Primary Residence, Savings, and Investing: Three Distinct Wealth Functions

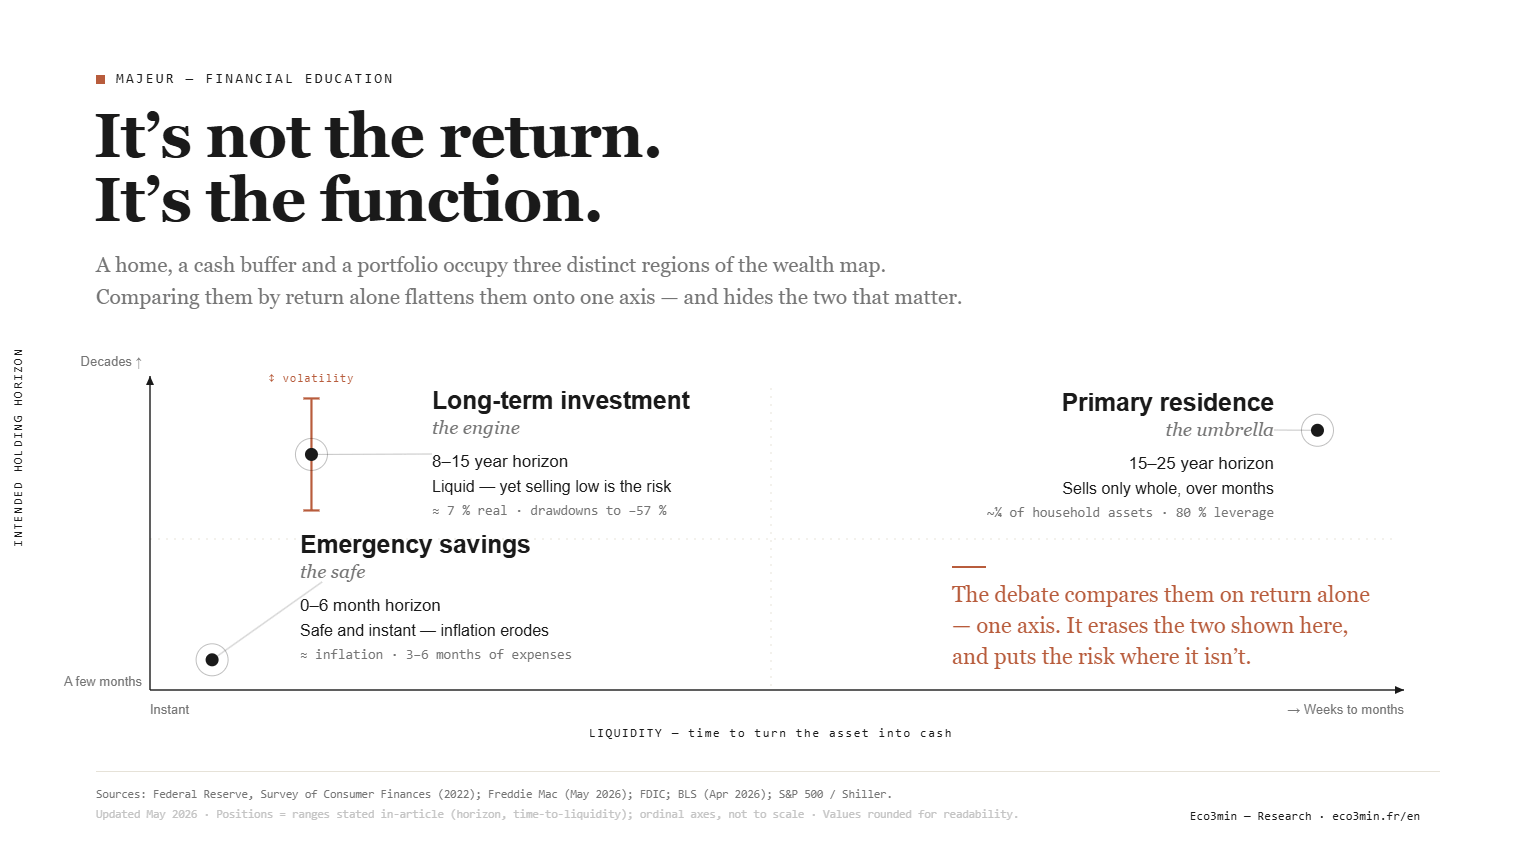
A primary residence, an emergency fund, and a long-term portfolio serve radically different functions in a household balance sheet. Judging all three by the same metrics — annual yield, historical performance — is like rating an umbrella, a safe, and an engine against a single criterion.
TL;DR
A primary residence, an emergency fund, and a long-term portfolio answer three different needs — shelter, liquidity, growth — over horizons of 15–25 years, months, and 8–15 years respectively.
- US household wealth is concentrated in the home: the primary residence is the single largest asset on balance sheets in aggregate and the bulk of net worth for the typical middle-class owner (Federal Reserve, Survey of Consumer Finances 2022).
- The 30-year fixed mortgage rate climbed from a record-low 2.65% in January 2021 to about 6.5% (Freddie Mac, May 2026), raising the monthly cost of financing a given home by more than 50%.
- The S&P 500's roughly 10% long-run nominal total return (about 7% real) came through drawdowns of −49% (2000–02), −57% (2007–09) and −34% (2020) — the risk premium an investor captures only by not being forced to sell.
Why Comparing Your Home to a Stock Portfolio Makes No Sense
What sets these three wealth pillars apart is not their return — it is the function each one performs.
A primary residence protects a way of life. An emergency fund guarantees the ability to react to the unexpected. Long-term investing builds financial wealth over time. The empirical detail is documented in our analysis of the Eco3min financial simulators. These three functions are not measured with the same tools, do not carry the same risks, and are not assessed over the same horizon. A direct extension of this logic: the structural role of time in financial decisions.
This distinction looks obvious, yet it is violated daily — even by sophisticated savers. How many discussions compare “the return on real estate” with “the return on stocks” without noting that one is illiquid and tied to a place to live, while the other is liquid and detachable from any personal constraint? This article lays out the analytical framework those comparisons are missing — a framework useful to anyone questioning the structure of their wealth. The underlying conceptual distinction between the three wealth logics is developed in our study on saving, placing, and investing.
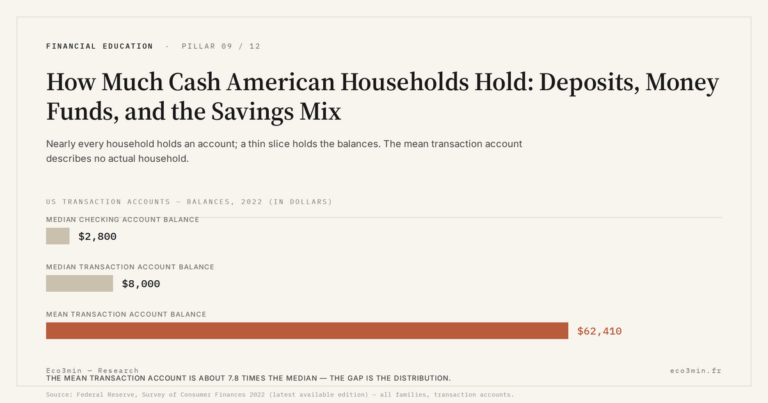
The most structural wealth decisions — buying a home, building savings, investing for the long run — produce effects that are neither measured over the same horizon nor with the same indicators. In the US, the primary residence is the single largest asset on household balance sheets: it accounts for about a quarter of all household assets in aggregate, and far more than that for the typical middle-class homeowner, for whom home equity is the bulk of net worth (Federal Reserve, Survey of Consumer Finances 2022). Such a household does not simply hold a valuable asset — it holds an asset that is illiquid, concentrated, and most often financed with debt. That is not the same reading as a diversified portfolio of equal size. Understanding this distinction is the starting point of any structured wealth thinking. Worth reading alongside: the Rule of 55 and 72(t).
This framework fits within the broader reflection on everyday financial trade-offs, where every decision involves a specific horizon, risk, and opportunity cost.
- Primary residence = use function (shelter), 15–25 year horizon, illiquid, usually financed with a mortgage
- Emergency fund = safety function (react to the unexpected), horizon of a few months, liquid, low yield
- Long-term investment = return function (grow wealth), 8–15 year horizon, volatile but rewarding
What sets these three pillars apart is not their return — it is the function each one performs. A primary residence is a use asset, illiquid, whose value depends on local factors (job market, demographics, transit) and whose “sale” implies a life change — not a simple financial rebalance. An emergency fund deliberately sacrifices yield for immediate availability. Long-term investing accepts volatility as the price of the risk premium. Comparing these three functions by annualized return alone is like judging a home, an insurance policy, and a growth engine by a single criterion — and biasing the trade-off before it has even been framed. The right question is not “which one yields the most?” but “which function is missing from my balance sheet?”
The Primary Residence: A Life Commitment, Not a Financial Investment
Buying a primary residence is often framed as “the first investment.” That is a category error that misguides the decisions that follow. A primary residence answers, first and foremost, a use function: shelter, anchoring family life, stabilizing daily routine. It locks up capital over a long horizon — the standard US loan is a 30-year fixed-rate mortgage — without generating cash flow that can be tapped day to day. A related read: why a primary residence is neither a financial asset nor just a roof.
The owner-occupier nonetheless earns a real but invisible return: the rent they no longer pay to a landlord. If a comparable home rents for $2,000 a month, the owner-occupier effectively “collects” $24,000 a year in kind — a flow that the national accounts capture (as “imputed rent,” tracked by the BEA) but that everyday wealth calculations ignore. This implicit return is real, but it can neither be reinvested nor mobilized in an emergency.
What fundamentally separates a residence from a financial asset is its relative irreversibility. Selling it means moving, switching schools for the kids, breaking a way of life — not a click on a trading app. Its value depends on local factors — neighborhood demographics, the job market, transit quality, energy efficiency — far more than on global financial parameters. It is an asset that is not a conventional financial asset, and treating it as one leads to structural allocation errors. In the current cycle, the interaction between the housing credit cycle and positive real rates sharpens this distinction: the monthly cost of financing a given home has risen by more than 50% since early 2021, as the 30-year fixed rate climbed from a record-low 2.65% to roughly 6.5%.
Emergency Savings: The Price of Peace of Mind
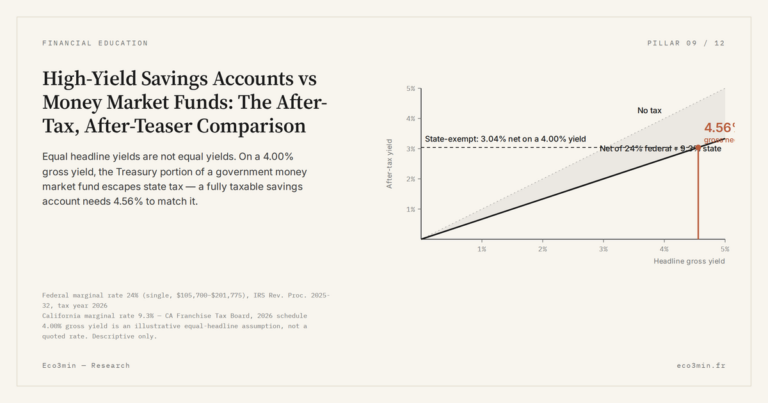
Emergency savings — high-yield savings accounts, money market funds, short-term CDs, Treasury bills — serve a radically different function: guaranteeing immediate availability against the unexpected. They must be mobilizable without delay, without loss of principal, and without friction. They are insurance, not an investment.
Americans hold trillions of dollars in savings and money market accounts — yet most of it sits at the FDIC national-average savings rate of roughly 0.4%, while top high-yield savings accounts and money market funds pay around 4–4.5% (mid-2026). With CPI inflation running near 3.8% (BLS, April 2026, lifted by an energy shock), a high-yield account roughly keeps pace with inflation, while an average bank account quietly loses purchasing power every year. But that spread — positive or negative depending on where the cash sits and where the cycle is — is not the relevant criterion. Whether the account beats inflation by a point or trails it by three changes nothing about its function: immediate availability and capital protection. Yield is the price, not the objective. In depth: the after-tax cost of the cash-to-equities move.
The most common mistake is to look at that yield through an investor’s lens and conclude that “savings earn nothing.” That confuses the function. An emergency fund is not there to enrich — it is there to avoid being forced to sell an investment at a loss or to borrow in a panic when something goes wrong (job loss, major repair, divorce). Its value is measured not in annual yield but in months of expenses covered. Converging consumer-finance guidance (CFPB, FINRA) places the comfort zone at three to six months of essential expenses.
Long-Term Investment: Accepting Volatility to Capture a Structural Return
Investing for the long run — stocks, bonds, rental real estate, private equity — means accepting risk exposure in exchange for a higher expected return. The horizon runs in years, sometimes decades. Intermediate volatility is not an accident: it is the very mechanism of the risk premium — the compensation the market offers to those willing to bear uncertainty.
Over the long run, the S&P 500 has delivered roughly a 10% annualized nominal total return — close to 7% after inflation. Concretely, $10,000 invested in a broad US stock index in 1988 would have grown to more than $250,000 by 2023 with dividends reinvested — a more than 25-fold increase. But that figure masks deep drawdowns along the way: roughly −49% in 2000–2002, −57% in 2007–2009, and −34% in early 2020. An investor who sold at the 2009 bottom would have turned a strong long-run investment into a permanent loss. The essential distinction is here: the return is structurally tied to holding period and to the ability to weather stress episodes without being forced to sell. This is why long-term investing only works if the emergency fund is already in place — the first protects the second. A related mechanism: why a portfolio’s value depends on when you measure it.
- Primary residence: the single largest asset on US household balance sheets — about a quarter of all household assets in aggregate, and the dominant asset for the typical middle-class homeowner (Federal Reserve, SCF 2022). Standard loan: 30-year fixed. Current rate ~6.5% (Freddie Mac, May 2026) vs a record-low 2.65% in January 2021.
- Emergency savings: top high-yield savings accounts and money market funds pay ~4–4.5% APY, vs an FDIC national-average savings rate near 0.4% (2026). CPI inflation ~3.8% (BLS, April 2026). Real return: near break-even in a high-yield account, clearly negative in an average bank account — but yield is not the criterion of the function.
- Long-term investment: S&P 500 ~10% annualized nominal total return long-run (~7% real), with drawdowns of −49% (2000–02), −57% (2007–09), and −34% (2020). Coherent horizon: 8–15 years minimum.
Why Comparing Them Directly Produces Allocation Errors
The most widespread reflex is to line these three vehicles up side by side and compare their “return.” That comparison produces analytical distortions that misguide decisions. The reasoning continues in Asset Liquidity: The Hidden Criterion in Wealth Decisions.
Horizon: an emergency fund is thought in months, a primary residence commits 15 to 25 years, and long-term investing only reaches coherence beyond 8 to 10 years.
Liquidity: an ETF sells in seconds, a home takes weeks to months to sell (and carries transaction costs of several percent), regulated savings are available instantly.
Structural risk: a primary residence concentrates risk (a single asset, a single location), investing diversifies, an emergency fund guarantees principal.
The time horizon is the first differentiator. Applying an annual-yield criterion to an asset whose logic is multi-decade makes no analytical sense. Stretched over decades, that horizon changes the very nature of debt — the mechanism behind how twenty years of borrowing turn time into leverage. Saying “real estate returned 3% a year and stocks 8%” without noting that the first is financed with 80% leverage, that the second suffered 50%+ drawdowns along the way, and that the two operate on incomparable horizons and liquidity levels, is comparing functions — not returns.
The role of liquidity in real risk is the second differentiator, too often ignored. An asset’s liquidity profoundly changes its risk profile: an illiquid asset cannot be sold quickly when cash is needed, creating a risk of a wealth dead-end that listed assets do not carry. A household with nearly all its wealth in its home that loses its job cannot “sell a bedroom” to cover expenses — it is forced to sell the whole thing, in a market that may be unfavorable, over a span of months. It is this liquidity asymmetry — not the return — that makes the direct comparison misleading.
Comparing the return on a primary residence to a stock portfolio while ignoring differences in liquidity, taxation, and leverage. A home bought with 20% down and 80% financing shows an artificially high “return on equity” in an up phase — and an amplified risk of capital loss in a down phase. One omission stands out in that comparison: the implicit rent owner-occupiers never calculate. Treating the emergency fund as an “underperforming” investment when it serves an irreplaceable safety function — that is mistaking an umbrella for an engine. Reasoning in nominal returns without factoring in inflation, taxes, and real transaction costs. An 8% gross return that becomes 5% net of inflation and 4% net of taxes tells an entirely different story from the headline figure.
| Primary residence | Emergency savings | Long-term investment | |
|---|---|---|---|
| Primary function | Shelter (use) | React to the unexpected (safety) | Grow wealth (return) |
| Horizon | 15–25 years | 0–6 months | 8–15 years |
| Liquidity | Very low (weeks to months to sell) | Total (instant) | Variable (seconds to years) |
| Expected real return | Imputed rent + possible appreciation | Low, close to inflation (varies by cycle) | ~7% above inflation over the long run |
| Main risk | Concentration, illiquidity, local dependence | Erosion of purchasing power | Intermediate volatility, forced-selling risk |
| Leverage | Yes (80% on average) | No | Rarely (except rental property) |
The Right Lens: The Balance Sheet
The most operational framework is to read wealth like a balance sheet: assets on one side, liabilities on the other, cash flows in between. A primary residence appears on the asset side but is most often matched by a long-term banking liability (a mortgage). The interaction between housing wealth, credit conditions, and rate cycles is the subject of our Real Estate, Credit and Rate Cycles pillar. Emergency savings are a net liquid asset (no debt against them). Long-term investments sit in an intermediate zone — sometimes liquid, sometimes constrained by holding periods or exit penalties.
This balance-sheet framework allows for a far more useful question than “what is the best investment?”: what is the structure of my wealth, and what risks does that structure create in the event of a shock? A household whose net worth is overwhelmingly tied up in its primary residence — the dominant case for the typical middle-class homeowner (Federal Reserve, SCF 2022) — does not hold a “solid” portfolio; it holds a concentrated and illiquid one. If income declines (job loss, illness), if rates rise (mortgage refinancing), or if the local market deteriorates (business closures, demographic decline), financial constraints materialize with little room for rapid adjustment. The corrective to that concentration is functional rather than cosmetic — a point developed in why diversification is not about owning a bit of everything.
The relevance of a wealth vehicle should therefore not be judged by its standalone return, but by its function within the overall balance-sheet architecture. A primary residence provides life stability. Emergency savings provide flexibility in the face of shocks. Long-term investment provides growth. None of the three can substitute for the other two — and a portfolio missing one of them is structurally fragile, regardless of the returns delivered by the remaining components. Also relevant: Life Horizon and Wealth: Why the Same Assets Don’t Suit Every Age.
What Public Debate Misses — and the Framing Error That Follows
The dominant public debate on wealth — “buy or rent?”, “stocks or real estate?” — is framed as a contest between alternatives. This lens systematically produces biased answers because it forces comparisons between vehicles that do not serve the same function. The first of those duels hides a deeper flaw, dissected in what the classic buy-or-rent calculation misses.
The question “should you buy your home?” has no universal answer — it depends on geographic stability, borrowing capacity, the local price-to-rent ratio, and the structure of the rest of the balance sheet. The mortgage-capacity mechanism behind that borrowing capacity is documented in interest rates and real estate purchasing power. A household with no emergency savings that deploys all available resources into a property purchase is not making a “good investment” — it is creating structural fragility. A regime-by-regime treatment can be found in the view on household financial choices. Conversely, a household that indefinitely accumulates cash in low-yield accounts without ever investing permanently sacrifices future purchasing power.
The popular consensus — “real estate is safe” — relies on survivorship bias: we remember homeowners whose property appreciated and forget those who bought in the wrong place, at the wrong time, or without financial flexibility. The balance-sheet comparison between real estate and financial assets shows that real estate “safety” is conditional — it depends on leverage, location, and the ability to avoid forced selling.
How These Three Logics Interact in the Current Cycle
The 2025–2026 macro regime — positive real rates, re-accelerating inflation, subdued growth — alters the balance among the three wealth pillars in specific ways.
For primary residences. The monthly cost of financing a given home has risen by more than 50% since early 2021, as the 30-year fixed rate climbed from a record-low 2.65% to roughly 6.5% (Freddie Mac). The housing market is frozen by a lock-in effect: tens of millions of owners holding sub-3% mortgages have no incentive to sell, choking inventory and transaction volumes. The housing credit cycle remains restrictive, with corrections playing out mainly in real terms (inflation-driven erosion) — one of the channels examined in the complete guide to inflation. In this environment, housing absorbs a larger share of household resources for comparable shelter — mechanically reducing capacity to fund the other two pillars.
For emergency savings. The gap between a high-yield account (~4%) and the average bank account (~0.4%) is the defining feature of this cycle: the same dollar earns a small real return or quietly loses ground depending only on where it is parked. With inflation re-accelerating toward 3.8% in spring 2026, the temptation to chase yield by moving the emergency fund into equities, long-dated CDs, or illiquid alternatives is the most widespread sequencing mistake — trading away the safety function for a marginal return. The cumulative cost of that inaction is documented in the true cost of leaving savings exposed to inflation, explored further in the dedicated analysis on financial education.
For long-term investment. The return of positive real rates reshapes the risk/return equation across asset classes. For housing in particular, the conditional nature of inflation protection in this regime is examined in the real estate inflation-hedge paradox. Bonds now offer positive real yields for the first time in over a decade — an alternative absent in the 2010–2021 regime. Equity valuations (the Shiller CAPE above 35 in late 2025) embed an optimistic scenario whose realization is not guaranteed. This context does not mean investors should stop investing — it means horizon and diversification matter more than entry timing.
Invalidation condition. This functional framework (use / safety / return) would lose relevance if a regime of persistently negative real rates returned, eliminating the opportunity cost of holding an emergency fund, or if major regulatory changes (public guarantees on investments, full housing portability) altered the liquidity and risk characteristics of any of the three pillars.
Three Time Horizons to Structure Wealth Decisions
Short term (0–12 months): ensure emergency savings cover 3–6 months of essential expenses. This is the foundation — without it, every other wealth decision rests on fragile ground. If the buffer is missing, rebuild it before any other allocation.
Cycle horizon (1–5 years): assess balance-sheet structure — what share of assets is illiquid? What is the debt-to-net-worth ratio? The ability to absorb shocks (income loss, housing downturn, rising rates) without being forced to sell assets under adverse conditions is the true indicator of financial resilience — not component returns. What a balance sheet is worth also depends on when it is read — the case made in why the moment of measurement matters in wealth valuation.
Structural horizon (5+ years): long-term investing only delivers compounding effects beyond 8–10 years. Starting early, even with modest amounts, is mechanically more effective than investing large sums late — a compounding effect confirmed across every decade of US equity history. The key is not market timing but holding period and consistency. Regular monitoring via the weekly macro brief helps contextualize these decisions within the current cycle.
The relevance of a wealth vehicle is not determined by its standalone return but by its function within the overall balance-sheet architecture. A primary residence is not an investment — it is a use asset whose “sale” implies a life change. Emergency savings are not an underperforming investment — they are insurance whose value is measured in months of expenses covered. Long-term investing is not gambling — it is a wealth-creation mechanism whose return is structurally tied to holding duration. None of the three can substitute for the others, and a portfolio missing one is structurally fragile regardless of the returns delivered by the remaining components. The right question is not “which one yields the most?” but “which function is missing from my balance sheet?”
Robust: The functional distinction use/safety/return is structurally cycle-independent. Primary residence illiquidity is structural (weeks to months to sell, plus transaction costs). The behavior gap linked to the absence of emergency savings (forced selling at market lows) is empirically documented. The real return of US large-cap stocks (~6–7% above inflation over the long term) is confirmed across decades.
Context-dependent: Rate levels, savings yields, and housing-market conditions vary by cycle. The optimal balance among the three pillars depends on individual circumstances (age, income, job stability, family structure). Future equity and real estate returns are inherently uncertain.
This framework underpins the broader wealth analysis developed across all articles dedicated to financial education. It does not prescribe an optimal allocation — it provides the lens needed to ask the right question before seeking the answer.
- Primary residence, savings, and investment serve three distinct functions — use, safety, return — that cannot be compared on annualized yield alone.
- A primary residence is an illiquid use asset, not a financial investment. “Selling” it implies a life change, not a portfolio rebalance.
- Emergency savings deliberately sacrifice yield for availability. Their value is measured in months of expenses covered, not annual return.
- Long-term investing accepts volatility as the price of the risk premium. It only works if emergency savings are already in place — the first protects the second. But emergency cash itself is not free of risk — see the true cost of leaving savings exposed to inflation.
- The right wealth question is not “which one yields the most?” but “which function is missing from my balance sheet, and what risks does that structure create in a shock?”
Frequently Asked Questions
Is real estate a better investment than stocks?
The question is misframed. Real estate (primary residence) and equities (long-term investment) serve different functions. Comparing returns without accounting for differences in liquidity, leverage, taxation, and time horizon produces misleading answers. Rental property, however, is closer to an investment — though with distinct characteristics (illiquidity, management burden, taxation) that differentiate it from listed portfolios. The arithmetic from gross yield to net-net profitability — including the cost-of-capital channel — is detailed in our analysis of rental property profitability.
How much should be kept in emergency savings?
Converging consumer-finance guidance (CFPB, FINRA) recommends 3–6 months of essential expenses. The amount varies with income stability (salaried employees with stable jobs need smaller buffers than freelancers), family composition, and the existence of safety nets (unemployment insurance, health coverage). What matters is immediate availability and capital protection — not yield.
Should I prepay my mortgage or invest?
This depends on the gap between the mortgage rate and the expected investment return, taxation, and — most importantly — overall balance-sheet structure. A household without emergency savings typically builds that buffer first. A household with a sub-3% mortgage locked in 2020–2021 and investing at 5–6% net enjoys a wide favorable spread, so prepaying rarely makes sense. A household with a 6.5% mortgage faces a much tighter trade-off. The answer is never universal — it depends on the individual balance sheet.
Last updated — 12 July 2026
Disclaimer – Financial Information: The analyses, commentary, and content published on eco3min.fr are provided for informational and educational purposes only. They do not constitute investment advice or a solicitation to buy or sell financial instruments. Past performance is not indicative of future results. All investment decisions involve risk and are the sole responsibility of the reader.
Read next
Full pillar →Where the Livret A’s Money Goes: The Caisse des Dépôts Circuit and Social-Housing Finance
The savings held on Livret A accounts do not sit idle. A regulation-set share is centralised at the…
France’s LEP vs the Livret A: A Means-Tested Higher Rate, Explained
France’s Livret d’épargne populaire is often described as "the Livret A, only better". The description misleads: the LEP…
France’s Livret A Ceiling: What Happens Mechanically When a Capped Savings Account Is Full
France’s Livret A ceiling, €22,950, is one of the best-known figures in French saving and one of the…