
The U.S. Dollar as a Systemic Variable in the Global Monetary System
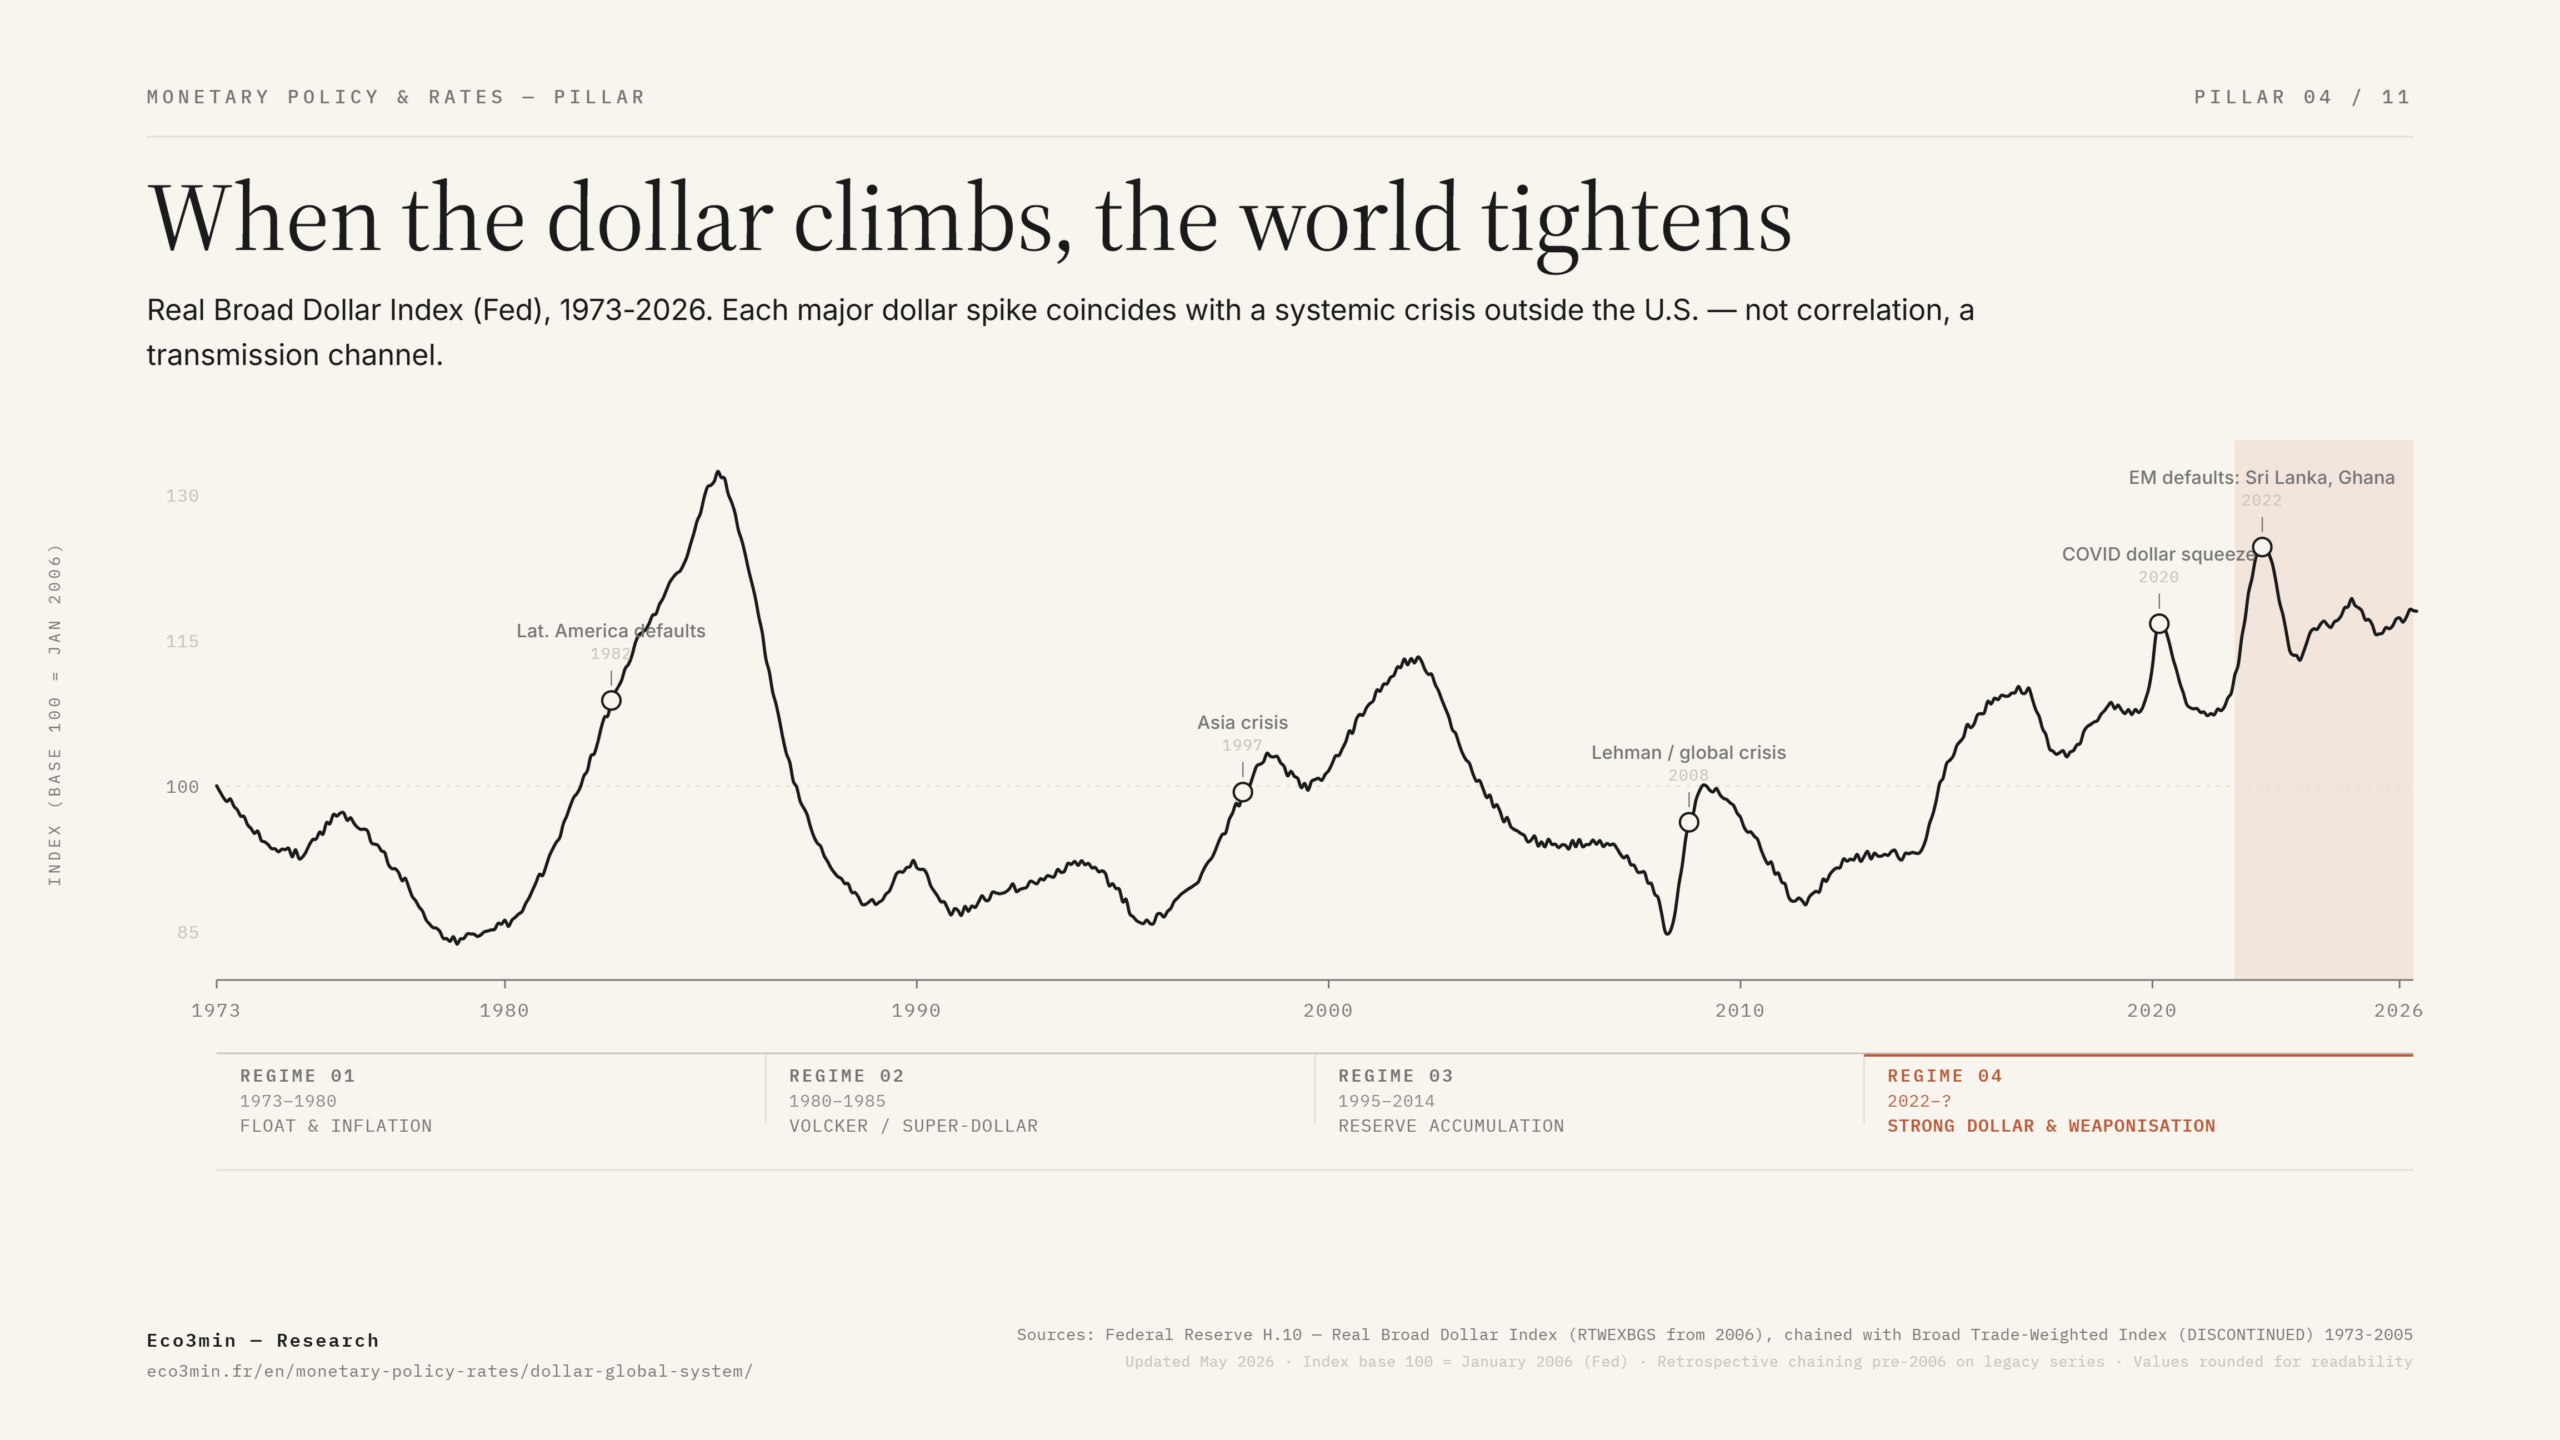
Four successive monetary regimes; major dollar moves coincide with systemic crises outside the United States — the dollar as the systemic variable of the global monetary system.
The dollar is not a currency like any other. It forms the backbone of the international monetary system, linking U.S. monetary policy, global capital flows, and financial stability. The dollar is the national currency of the United States — but the world’s funding currency. When the Fed tightens, it is not only the U.S. economy that absorbs the shock: the entire global dollar system, from emerging markets to European bank balance sheets, experiences tighter financial conditions.
This page analyzes the dollar as a systemic variable, at the intersection of U.S. monetary policy, international capital flows, and episodes of financial stress. The objective is not to forecast the next move in the DXY, but to understand why the dollar structures global financial conditions far beyond what its share of global GDP — around 26% (IMF, 2024) — would suggest, and how this translates concretely into portfolio-level effects.
The dollar in numbers: unmatched dominance
The dollar’s grip on the international financial system can be measured across four dimensions which, taken together, reveal a hegemonic position with no historical equivalent for a national currency. However it is measured, that dominance shapes who writes the rules others end up following, which is the crux of the obstacles to cross-border regulatory alignment.
Foreign exchange reserves. The dollar accounted for 58.4% of identified global foreign exchange reserves in Q3 2024, according to IMF COFER data. This figure has declined from the 72% peak reached in 2001 — a slow but steady erosion in favor of the euro (20%), yen (5.8%), and yuan (2.2%). Yet the dollar’s share remains three times larger than that of its closest competitor.
FX transactions. The dollar is involved in 88% of foreign exchange market transactions, whose daily volume reached $7.5 trillion in 2022 (BIS, Triennial Survey). This omnipresence makes the dollar the essential vehicle currency for international trade — including transactions between two countries with no direct trade ties to the United States.
International debt. Roughly 49% of international debt is denominated in dollars (BIS, December 2023), representing more than $13 trillion in debt securities issued by non-U.S. entities. Every dollar movement mechanically alters the real burden of this debt — a transmission channel often underestimated in cyclical analysis.
Commodities. Oil, liquefied natural gas, base metals, and grains are traded overwhelmingly in dollars — between 80% and 90% of transactions according to BIS and OPEC estimates. This pricing convention means a stronger dollar mechanically raises input costs for non-U.S. economies, even when underlying prices remain unchanged.
The exorbitant privilege: mechanisms and limits
The expression “exorbitant privilege,” coined by Valéry Giscard d’Estaing in the 1960s, refers to the structural advantage the United States derives from the dollar’s status as the world’s reserve currency. U.S. federal debt is entirely denominated in dollars — a currency the United States can issue — effectively eliminating foreign-currency default risk. Global investors, required to hold dollar assets for reserve purposes, accept lower yields — a “reserve premium” estimated between 50 and 100 basis points in academic literature (Krishnamurthy & Vissing-Jorgensen, 2012). Related coverage: Half-year dollar moves in historical placement.
This privilege concretely enables the United States to finance twin deficits — fiscal and current account — under conditions that would be unsustainable for any other economy. The U.S. current account deficit has fluctuated between 3% and 4% of GDP for two decades (BEA), financed by continuous foreign capital inflows attracted by the depth and liquidity of U.S. financial markets. The breakdown of the current account deficit as a structural macroeconomic risk examines the conditions under which this equilibrium could break.
This structural role explains why U.S. monetary cycles transmit far beyond U.S. borders. Each Fed tightening acts as a global tightening: higher dollar debt costs, capital repatriation toward U.S. assets, and compressed offshore liquidity. This mechanism, analyzed in the real impact of monetary policy, makes the Fed the de facto central bank of the world — a role it has never officially accepted but effectively exercises through the dollar system.
The eurodollar system: the invisible infrastructure
One of the most misunderstood realities of the global financial system is that the majority of dollars in circulation are neither created nor directly controlled by the Federal Reserve. The “eurodollar system” — unrelated to the euro, the term dates back to the 1950s — refers to all dollar-denominated deposits and loans held and created outside the U.S. banking system. The wider context: the broad dollar index as a strength gauge.
The BIS estimated the stock of dollar credit outside the United States at more than $13 trillion at end-2023 (BIS, Global Liquidity Indicators). This likely understates reality, as it only partially captures banks’ dollar exposures via derivatives markets — FX swaps alone represented more than $100 trillion in notional outstanding (BIS, 2022), a “missing debt stock” in the words of Claudio Borio and BIS co-authors.
This offshore architecture means global dollar funding conditions depend on the capacity and willingness of international banks to supply dollars — a dependence whose plumbing mechanics are detailed in our liquidity and financial conditions framework — a mechanism largely beyond the Fed’s direct control. When interbank confidence deteriorates, offshore dollars suddenly become scarce, creating a shortage akin to severe monetary tightening — even if the Fed simultaneously eases domestic policy.
This mechanism was particularly visible during two major crises. In 2008, the Libor-OIS spread — a measure of stress in interbank dollar funding — reached 364 basis points in October (Federal Reserve), reflecting an acute offshore dollar shortage. The Fed responded by opening swap lines with 14 central banks, injecting up to $580 billion in liquidity in December 2008. In March 2020, the same mechanism reappeared even faster: the EUR/USD cross-currency basis swap — measuring the cost of dollar access for European banks — widened to -85 basis points (Bloomberg), forcing the Fed to reactivate and expand its swap lines within days. A complementary angle: the dollar shortage regime.
A standardized historical analysis of major financial crises since 1973 shows that in 71% of cases, the dollar was up year-over-year at the time of outbreak. See the full dataset: Dollar and global crises since 1973.
Four dollar regimes since 1971
The history of the dollar as the post-Bretton Woods global currency can be organized into four distinct regimes, each defined by a specific configuration of U.S. monetary policy, capital flows, and geopolitical balance of power. These regimes intersect with our framework on central bank decisions and rate cycles.
1971–1980: floating rates, inflation, and erosion of confidence
Floating rates, double-digit inflation, a dollar down 40% — and yet the greenback’s international role never wavers.
The suspension of gold-dollar convertibility by Nixon on August 15, 1971 opened the era of floating exchange rates. The dollar lost 40% of its trade-weighted real value between 1971 and 1978 (Federal Reserve, Real Broad Dollar Index). US inflation — averaging 7.4% annually between 1970 and 1982 (BLS) — eroded international confidence and fueled early discussions about reserve diversification. A useful reference here: DTWEXBGS: Reading the Broad Dollar Index as a Systemic Strength Signal. The Dollar Index (DXY) fell from 120 in 1971 to a low of 82 in October 1978.
Paradoxically, this period of weakness did not undermine the dollar’s global role. Petrodollar recycling — oil exporters reinvesting surplus revenues into US Treasuries — strengthened the structural link between the dollar and commodities. Recycling agreements with Saudi Arabia (1974) institutionalized the “petrodollar” system, anchoring crude oil pricing in dollars for decades to come.
1980–1985: the Volcker dollar and the emerging debt crisis
Volcker takes rates to 20%, the dollar doubles, and more than 40 dollar-indebted countries tip into default.
Paul Volcker’s radical tightening — Fed Funds at 20% in June 1981 (Federal Reserve) — triggered a spectacular dollar appreciation. The DXY surged from 85 in 1980 to a peak of 164 in March 1985, effectively doubling in five years. US real rates exceeded 5%, attracting massive foreign capital inflows.
This “super dollar” had devastating consequences for emerging economies indebted in dollars. Mexico defaulted in August 1982, followed by Brazil and Argentina. In total, more than 40 countries restructured their debt during the decade (IMF). The lesson was clear: in a world where roughly half of international debt is denominated in dollars, a sharp dollar appreciation functions as a global financial tightening — a mechanism later formalized by Hélène Rey (2013) under the concept of the “global financial cycle,” with the dollar at its core. Further detail: our study on the near-collapse of U.S. net investment income.
The excess was corrected through the Plaza Accord in September 1985, when the United States, Japan, Germany, France, and the United Kingdom coordinated an orderly dollar depreciation — the last major episode of concerted FX intervention.
1997–2008: emerging crises and paradoxical reinforcement
Burned by 1997, emerging economies hoard dollar reserves — and reinforce the very system they fear.
The 1997–1998 Asian crisis revealed a structural vulnerability of the dollar system: countries that had accumulated dollar debt while earning revenues in local currency were trapped when their currencies collapsed. The Thai baht lost 55% of its value in six months, the Indonesian rupiah 80%. Contagion spread to Russia (default in August 1998) and Brazil (crisis in January 1999).
Emerging economies responded by massively accumulating dollar foreign exchange reserves as insurance against future crises — paradoxically reinforcing the dollar system. Global FX reserves rose from $1.8 trillion in 2000 to $12 trillion in 2014 (IMF COFER), with more than 60% held in dollars. China alone held $4 trillion in reserves at its 2014 peak (PBoC). This accumulation financed US deficits and kept long-term rates low — the “global savings glut” described by Ben Bernanke in 2005.
2022–?: strong dollar, weaponization, and geopolitical tensions
The fastest tightening since Volcker revives the classic channel — strong dollar, emerging stress — now paired with a new weapon: reserve freezes.
The Fed’s tightening cycle in 2022–2023 — 525 basis points in 16 months — triggered a dollar appreciation reminiscent of the Volcker era. The DXY reached 114 in September 2022, its highest level since 2002 (Federal Reserve). The euro briefly fell below parity (0.96 in September 2022), the yen weakened to 152 per dollar — its lowest level since 1990 — and sterling dropped to $1.035 during the brief Truss budget crisis in October 2022.
This sequence reactivated the classic channel: strong dollar, emerging stress. Sri Lanka defaulted in May 2022, Ghana in December 2022, Ethiopia in December 2023. But this time the phenomenon carried an unprecedented geopolitical dimension: the freezing of the Russian central bank’s reserves in February 2022 — roughly $300 billion in immobilized assets (ECB, Federal Reserve) — demonstrated that the dollar system can be weaponized, transforming economic privilege into an instrument of geopolitical coercion.
These dynamics are closely linked to stress episodes described in monetary crisis scenarios.
Strong dollar = global tightening: transmission mechanics
A strong dollar does more than alter exchange rates. It acts as a multiplier of global financial tightening through several simultaneous channels whose effects compound.
How a strong dollar tightens the world
Three simultaneous channels whose effects compound.
Higher dollar debt burdens
For an emerging economy with 60% dollar-denominated external debt, a 15% appreciation raises repayment costs proportionally — a rate hike without the Fed moving. Emerging market external dollar debt exceeded $4.2 trillion at end-2023 (BIS).
Capital flight
A stronger dollar plus more attractive US yields triggers capital repatriation toward the United States at the expense of emerging markets. The IIF documented $100 billion in net EM outflows between March and October 2022 — comparable to the 2013 taper tantrum.
Commodities in local currency
A country importing oil in dollars faces a double shock: higher local-currency cost even at stable dollar oil prices, and imported inflation forcing its central bank to tighten — a procyclical amplification of US tightening.
Imported inflation →Analyzing dollar movements as a simple reflection of rate differentials. The dollar also embeds capital flows driven by risk aversion (flight to safety), trade dynamics, and geopolitical expectations. In March 2020, the dollar appreciated sharply despite a 150-basis-point Fed rate cut in two weeks — evidence that safe-haven demand can dominate monetary signals.
Currency swaps and emergency stabilization
During systemic crises, offshore dollar shortages threaten to destabilize the global financial system. Swap lines between the Fed and foreign central banks serve as the ultimate mechanism to inject dollars outside the United States. A new tier extends this offshore dollar architecture — see the offshore dollar plumbing layer that stablecoins now occupy.
First activated at scale in December 2007, these facilities were heavily used during the 2008 crisis — peaking at $580 billion outstanding in December 2008 (Federal Reserve). They were made permanent in October 2013 between the Fed, ECB, BoJ, BoE, SNB, and Bank of Canada, forming a safety network for major currencies.
In March 2020, the Fed expanded this backstop by opening temporary swap lines with nine additional central banks and launching the FIMA Repo Facility — allowing foreign central banks to obtain dollars in exchange for Treasuries without using markets. Outstanding swaps peaked at $449 billion in May 2020 (Federal Reserve).
This framework illustrates the dollar’s centrality in crisis management — but also a fundamental asymmetry: only countries with access to Fed swap lines benefit from this safety net. Others — most emerging markets — remain exposed to dollar shortages without direct recourse, relying on the IMF or markets for stress financing. This role complements the defensive monetary policy approach analyzed in our dedicated report.
De-dollarization: structural trend or illusion?
De-dollarization narratives have multiplied since the freezing of Russian reserves in 2022, supported by visible initiatives: bilateral trade agreements in yuan between China and Saudi Arabia, alternative payment mechanisms (mBridge, China’s CIPS system), and rising gold holdings in central bank reserves — net central bank gold purchases reached 1,037 tonnes in 2023, a record level (World Gold Council).
However, factual analysis suggests credible dollar alternatives remain structurally limited. The euro, the second reserve currency with 20% of global reserves (IMF COFER), lacks a unified safe asset — no euro-area equivalent to US Treasuries exists despite initial joint issuance (NextGenerationEU). The yuan accounts for only 2.2% of global reserves and 7% of FX transactions (BIS, 2022), constrained by capital controls incompatible with international reserve currency status. China’s bond market remains partially closed to non-residents. Related work: gold’s performance measured in currencies other than the dollar.
Monetary fragmentation paradoxically increases dollar demand. When geopolitical uncertainty intensifies, economic agents — corporations, banks, sovereign funds — increase dollar holdings as a safe asset rather than shift toward less liquid and less deep alternatives. The dollar’s share in SWIFT transactions remained around 47% in 2024 (SWIFT RMB Tracker), stable relative to prior years despite accelerating de-dollarization rhetoric. Comparing dollarization and de-dollarization across regimes maps the conditions under which one leads the other.
The most likely scenario is not abrupt de-dollarization but slow, partial erosion — a gradual transition from a unipolar system to one where the dollar remains dominant but less hegemonic, with regional niches for the yuan (China–Southeast Asia trade), the euro (intra-European trade), and gold (central bank reserves seeking diversification without geopolitical risk). If this transition materializes, it will unfold over decades — a time horizon often ignored in commentary predicting the dollar’s imminent decline. On that same multi-decade horizon sits a slower institutional project: public digital currencies issued by central banks.
The dollar is not just a currency — it is global financial infrastructure. Its dominance rests less on US economic power than on the absence of alternatives offering comparable depth, liquidity, and legal safety. The relevant diagnosis is not “Will the dollar lose its status?” but “Which structural conditions would need to change for that status to be genuinely threatened?” As long as the answer implies transformation of China’s capital markets, European fiscal union, or the emergence of a liquid and convertible sovereign digital asset — developments measured in decades — the dollar system remains the backbone of global financial conditions. Related material: our study on every US dollar bull and bear market since 1973.
Last updated — 30 July 2026
Disclaimer – Financial Information: The analyses, commentary, and content published on eco3min.fr are provided for informational and educational purposes only. They do not constitute investment advice or a solicitation to buy or sell financial instruments. Past performance is not indicative of future results. All investment decisions involve risk and are the sole responsibility of the reader.
Read next
Full pillar →DTWEXBGS: Long-Term Strong and Weak Dollar Cycles 1973-2026
DTWEXBGS, reconstructed through pre-2019 Fed series, has cycled through seven distinct phases since 1973. Volcker, Plaza Accord, Clinton,…
DTWEXBGS vs DXY: The Difference Between Broad and Narrow Dollar Indices
The DXY covers six developed-market currencies with weights frozen since 1973, 57.6% of which is the euro. DTWEXBGS…
DTWEXBGS Explained: Meaning, Calculation, and 26-Currency Weighting
DTWEXBGS aggregates the dollar against 26 partner currencies weighted by bilateral trade flows and refreshed annually. The formula…