
Gold Beyond the Dollar: A Dollar Record Is Not a Record Everywhere

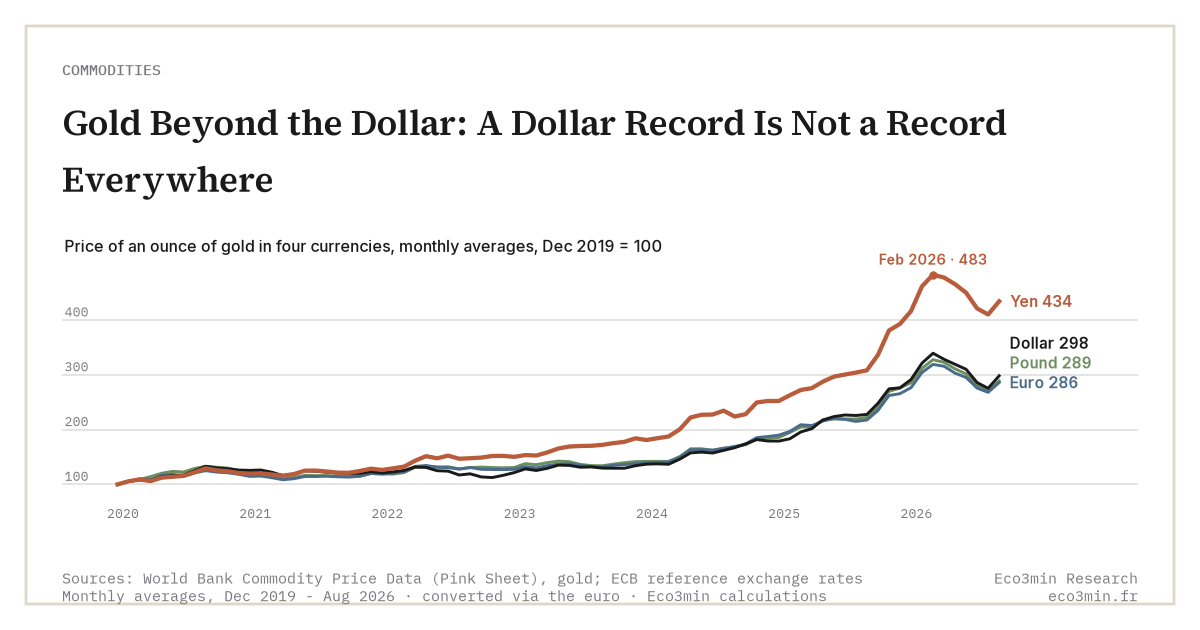
Announcing «gold at an all-time high» assumes a currency and a measure. The record differs depending on whether one counts in dollars, euros or yen, and on whether or not one adjusts for inflation.
TL;DR
Gold's record depends on two yardsticks, the currency it is priced in and whether the figure is inflation-adjusted, which shifts the peak's date and size by currency.
- On 12 June 2026 an ounce fixed at $4,186 (LBMA), down from a $5,405 record fix on 29 January; in euros, pounds and yen the peaks fell on 2 March, and the 12 June levels were €3,617, £3,122 and about ¥671,000.
- Gold's price in any currency is its dollar price multiplied by the exchange rate, so a weak yen amplified the climb for Japanese holders while a firmer pound trimmed the British gain.
- The January 1980 peak of roughly $850 an ounce, restated in today's dollars, ran into several thousand, a real benchmark the 2026 dollar surge exceeded, but only for the dollar and one inflation measure.
- From the 29 January record to 12 June gold shed 22.6% in dollars; with the yen sliding from roughly 153 to 160 per dollar (ECB), a Japanese holder felt a 19% decline.
The nuance is not pedantic: it changes the perceived size of the move, its date, and the conclusion an investor can draw depending on the reference currency.
«Gold at a record»: a record in which currency?
The headline returns with every surge: gold sets a new record. The phrase, almost always, is understood in dollars and in nominal terms, because the metal is priced first on the London market in the US currency and because most of the financial press reasons in dollars. This implicit framing shapes the perception of an asset that is, in fact, held all over the world. Read alongside: gold’s implicit dollar exposure.
Yet gold does not have one value, but as many values as the currencies in which it is expressed. Its price in euros, pounds or yen follows its own path, shaped by exchange-rate moves as much as by the metal itself. A record posted in New York may correspond, elsewhere, to a peak already passed, or not yet reached.
This primacy of the dollar stems from the market’s history. The metal has traded for decades around a reference price set in London and denominated in the US currency, which remains the main reserve and commodity-invoicing currency. Quoting in dollars is a practical convention, not a truth about the metal’s value for a holder outside the dollar zone.
Precision matters all the more because orders of magnitude differ sharply from one currency to another. Comparing an «all-time high» without saying in which unit, or whether it is nominal or real, amounts to setting heterogeneous measures side by side.
The stakes are all the sharper because the 2026 rise was broad-based, touching all the major currencies at once. When gold rises only against the dollar, the question of currency stays secondary; when it advances everywhere, the differences in magnitude between currencies become the core of the analysis, and the single dollar figure then says too little.
The same metal, staggered records
The 2026 figures illustrate it. On 12 June, an ounce of gold fixed at $4,185.95 at the LBMA afternoon auction, after a record fix of $5,405 on 29 January. Expressed in euros, it traded at €3,617, its own record (€4,538 at the LBMA fix) having been set on 2 March 2026, a month after the dollar peak, because the euro was then weakening against the dollar; the same lag holds for the pound (£3,964 on 2 March) and the yen (about ¥837,000 the same day, at ECB exchange rates). In pounds, it was worth on the order of £3,100; in yen, close to ¥672,000.
These gaps stem not from the metal, identical for all, but from the currencies. The dollar, euro, pound and yen did not move in the same way: the ounce in yen peaked at a proportionally far higher level, because the Japanese currency had weakened markedly. The price of gold in each currency is, mechanically, the dollar price multiplied by the corresponding exchange rate. This dependence on the greenback is at the heart of the inverse gold-dollar correlation: when the dollar weakens, gold rises for dollar holders, but less for those whose currency appreciates against it.
The decomposition rule is simple: for a holder outside the dollar zone, gold’s performance splits in two, the metal’s move in dollars on one side, that of their own currency against the dollar on the other. A relatively firm pound thus limited the British gain, where a weak yen amplified it. The point sheds light on gold as an anti-dollar signal from a concrete angle: its record is universal only if one ignores the currency in which it is read.
A concrete example fixes the idea. A euro-area investor who had tracked the metal since the start of 2026 did not live the same sequence as an American: the euro’s relative strength over the period trimmed part of the dollar-denominated rise, then cushioned part of the fall. The same chart, drawn in euros rather than dollars, shows different slopes and a peak dated otherwise.
What a holder in euros or yen sees
The consequence is tangible for anyone measuring wealth in a currency other than the dollar. A Japanese holder has seen, over recent years, gold rise far more in yen than in dollars, the weakening of their currency having amplified the metal’s climb. Conversely, an investor whose currency appreciated against the dollar booked a more modest gain than the New York headline suggested. A fuller treatment of the contrast sits in the case for strong dollar or weak dollar.
The 2026 retreat illustrates the same asymmetry. Between the 29 January record and 12 June, gold shed 22.6% of its value in dollars; but with the yen having weakened over the same period, from around 153 to 160 per dollar (ECB exchange rates), the decline felt by a Japanese holder was somewhat smaller, 19%, against 20% in euros and in pounds. The return actually experienced thus depends as much on the reference currency as on the metal. A companion piece: the supply geometry of oil, gas and metals.
The point holds even for institutions. A central bank that holds gold values its reserves in its own currency or in special drawing rights, and the «record» it observes depends on that choice of yardstick. There is no single, neutral gold price: there is always a currency of measure, explicit or not. Related discussion: gold as a monetary signal.
This gap is anything but trivial for an asset presented as a universal protection. The hedge gold offers is measured in the currency of the one who holds it, not in an abstract currency valid for all.
For a reader reasoning in euros, the reach is direct: the figure relayed by international media, almost always in dollars, does not exactly describe the value of their gold. The gap stays modest as long as the euro and the dollar move together, but it widens as soon as the two currencies diverge, as in phases of a strong or weak dollar.
The phenomenon, moreover, extends beyond gold alone. Any asset quoted in a single currency but held worldwide raises the same question: an equity index, a property price or a commodity show records that depend on the reading currency. Gold simply makes the problem more visible, because it is, by nature, a universal holding compared across all currencies.
Nominal is not real: the 1980 benchmark
There remains the second imprecision, more insidious: mistaking a nominal record for a real one. A price not adjusted for inflation compares poorly with the peaks of the past. The January 1980 peak, where the ounce approached $850, represents, once re-expressed in today’s dollars, a level far above its nominal figure, on the order of several thousand dollars. For decades, this real peak remained the true benchmark, which announcements of nominal «records» ignored.
The 2026 surge, for its part, exceeded even that real benchmark in dollars, which makes it a move of genuinely historic magnitude. But the observation holds only for the dollar and for a given inflation measure: the real comparison is redone in each currency, with its own price history. The detail of this adjustment appears in the analysis of gold’s real 1980 peak.
Combining the two imprecisions blurs the reading further. Depending on the currency and the deflator chosen, the moment gold crosses its real record varies: a Japanese holder, facing different inflation and exchange rates, does not place that threshold where an American holder does. The «all-time high» is therefore not a single date, but a cluster of dates depending on the yardstick.
This discipline echoes the one required by gold and US public debt, where the reading of the metal blurs if one neglects the underlying monetary erosion. Placed within the geoeconomics of resources, the question of the record becomes a question of yardstick: which currency, which date, which measure.
The perspective can be reversed. Rather than measuring gold in a currency, some measure currencies in gold, and read its rise as the depreciation of currencies rather than the appreciation of the metal. This inversion does not change the facts, but it recalls that the «price» of gold is a relationship, not an intrinsic property: it always depends on the chosen yardstick.
- An announced gold record is almost always nominal and dollar-denominated; in euros, pounds or yen, the peaks occur on other dates and at other levels.
- The price of gold in a currency is its dollar price multiplied by the exchange rate: the strength or weakness of each currency shifts the trajectory.
- A nominal record is not a real record: the historical comparison is made after adjusting for inflation, currency by currency.
Specify the currency and the measure
Gold remains a global asset, but its value makes sense only paired with a unit. Announcing a peak without saying in which currency, or whether it is real or nominal, delivers incomplete information, and at times misleading for anyone not reasoning in dollars.
The 2026 levels will stay open to several readings depending on the vantage point. The same price will tell a different story to a euro-area saver, a Japanese holder or an American investor. Caution lies less in following the record than in specifying, each time, the yardstick in which it is measured. The useful reflex fits in two simple questions: in which currency is the price expressed, and has it been adjusted for inflation?
Last updated — 6 October 2026
Disclaimer – Financial and Legal Information: The analyses, commentary, and content published on eco3min.fr are provided for informational and educational purposes only. They do not constitute investment advice or a solicitation to buy or sell financial instruments. Past performance is not indicative of future results. All investment decisions involve risk and are the sole responsibility of the reader. Data, charts and calculated series are provided as is and may contain errors or lag behind their source: check any figure against the primary source cited before relying on it. Content describing laws, regulations or contracts reflects the law as of its publication date and does not constitute legal or tax advice; applying it to a specific situation requires a qualified legal or tax professional.
Read next
Full pillar →Gold as a Monetary Signal: Real Yields, the Dollar and Central Bank Buying
Gold prices do not track inflation: they track the monetary opportunity cost of holding, itself driven by real…
Pure-play refiners versus integrated majors: downstream margin exposure
A pure-play refiner owns only the downstream, so its earnings track the refining margin. An integrated major also…
Jet fuel, the forgotten margin: the jet crack and the aviation link
The 3-2-1 crack spread reduces the refining margin to two products, gasoline and diesel. Jet fuel sits outside…