
From Copper to Inflation: How the Metal’s Price Transmits to Prices (PPI, CPI)

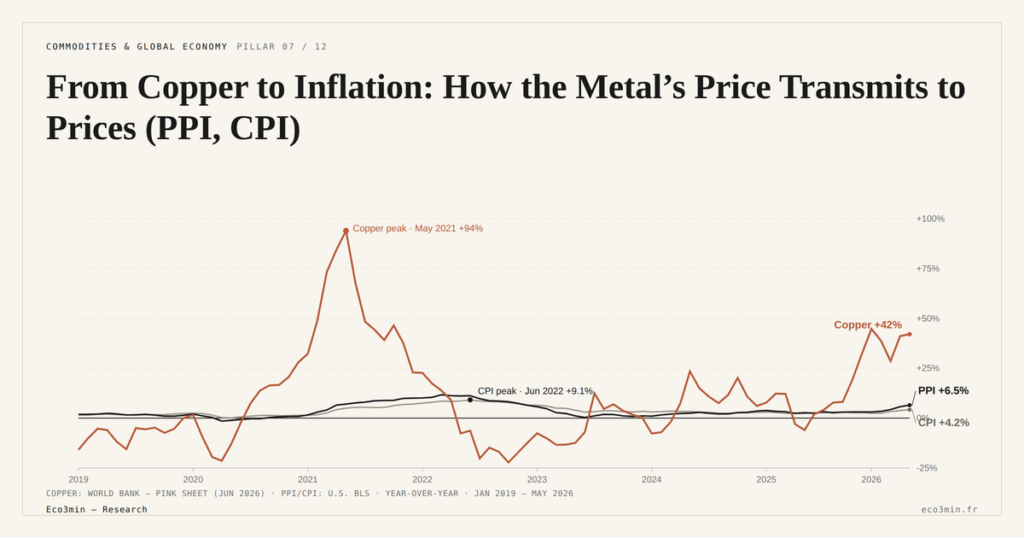
Copper is an industrial input: its price enters production costs before it reaches the consumer. A rise, especially a supply-driven one, can therefore feed cost-push inflation without vigorous demand being at play.
TL;DR
Copper's price imprint runs strong and fast in producer prices, then dampened and delayed by the time it reaches consumers, where the metal is a small share of value.
- When copper rises because mine supply is constrained rather than demand surging, cost-push inflation can build even as activity slows; a New York Fed analysis (February 2025) traces most of the persistent global inflation surge to supply shocks, which force central banks to trade off inflation against output.
- In advanced economies copper is a small fraction of a good's final price, so a doubling of the metal never doubles a fridge or a car, leaving only a modest contribution to headline inflation while assembly, design, brand and distribution carry the rest.
Understanding this channel clarifies a point often confused: inflation driven by a commodity shock is not a sign of an overheating economy. The mechanism, its reach and its limits are worth taking apart.
Copper is a cost, not a finished product
The consumer never buys copper directly. They buy appliances, vehicles, housing, electronics: goods in which the metal is only one component among many. The copper price therefore enters upstream, as an input cost for manufacturers, not as a final price. That position in the value chain shapes how a price move propagates: it first hits margins and producer prices, then, dampened and delayed, consumer prices. The silver market offers a point of comparison, treated in the cross-signals of silver and copper.
This transmission mechanism is one reason bond yields stayed high while growth softened, central to understanding why the copper-gold ratio decoupled. If a copper shock feeds cost-push inflation, long rates price that inflation regardless of the cycle. Set within the macro role of commodity cycles, the question is not only whether copper rises, but how and how fast its rise diffuses into prices.
From copper to PPI: the first step
The first imprint of a copper rise appears in the Producer Price Index (PPI), which measures prices received by producers. The example is concrete: per an RBC Economics analysis published in June 2026, when copper or aluminum prices jump, making an appliance becomes more expensive, and the manufacturer passes on some or all of that cost, pushing up the PPI for the goods involved. PPI thus acts as an early signal: price pressures show up at the producer level before reaching the consumer, making it a leading indicator for CPI. Tracking copper prices over time against PPI illuminates this first step.
Public series show the hierarchy. Year on year, copper (World Bank Pink Sheet, monthly average) peaked at +94% in May 2021; US producer prices (BLS, final demand) topped out at +11.6% in March 2022 and consumer prices at +9.1% in June 2022. In May 2026, copper was up 42% on a year earlier, final-demand PPI 6.4% in the first estimate (5.9% after revision) and CPI 4.2%. In August 2026, the latest month common to all three series, the metal reached $14,326 a tonne, a record monthly average (+48% year on year), the BLS copper and brass mill shapes index +20.9%, final-demand PPI +5.4% and CPI +3.4%, of which 2.4% excluding food and energy.
Academic work confirms this hierarchy. Studies on commodity-price transmission find partial pass-through to producer prices, with energy and metal shocks showing the largest effects at that level. This is exactly what commodities, inflation and monetary policy documents: the metal does not trigger broad inflation on its own, but it shifts the manufacturing cost of a wide range of goods, from wiring to electrical equipment. The strength of the signal at the producer stage comes from copper’s ubiquity across the productive economy.
Transmission moves through successive stages. Raw copper first feeds the price of semi-finished products (wire, tubes, components), then that of intermediate goods incorporating those components, and finally that of finished goods. At each stage, a lag is added and part of the extra cost is absorbed. That is why the Producer Price Index itself breaks down into stages (raw materials, intermediate goods, finished goods), and tracking these sub-indices is what lets one follow a shock along the chain. The further the final good sits from raw metal, the more copper’s share in its price is diluted.
From PPI to CPI: a partial, lagged pass-through
The pass-through from PPI to CPI (consumer prices) is markedly more muted. In advanced economies, copper’s share in a good’s final price is small: most value-add lies downstream, in labor, distribution and services. The pass-through to consumption is therefore more modest and delayed than to production. The literature notes, moreover, that there is no lasting link between the level of commodity prices and the level of consumer prices, but a relationship between commodity prices and the rate of inflation: a copper shock temporarily shifts the pace of increases, not the permanent level. The nature of that pass-through also depends on the make-up of copper demand, depending on whether the rise reflects a surge or a scarcity.
The size of the pass-through depends on context. A Banque de France study (Lemaire and Vertier, November 2022) estimates the transmission of commodity prices to consumer prices at about 30% in Africa, across seventeen food, energy and fertilizer commodities that exclude metals, a figure all the higher where the food and commodity share of the basket is large. In advanced economies, where that share is small, the pass-through to CPI is much lower. Another limit: only marked shocks actually diffuse; moderate moves are largely absorbed in corporate margins before reaching the price tag. Copper is thus a driver of consumer inflation only when its rise is large, durable and concentrated. Further detail: the headline-core commodity mapping.
In concrete terms, copper reaches the consumer through a few identifiable channels: appliances, automobiles, housing (via wiring and electrical equipment) and consumer electronics. But in each of these goods, the metal is only a fraction of the sale price, the rest resting on assembly, design, brand and distribution. A doubling of the copper price therefore never doubles the price of a refrigerator or a car: it raises its cost by a few points, spread over time. This dilution explains why a spectacular shock in metal markets translates, at consumption, into only a modest contribution to headline inflation. Related work: the regime-signal reading of commodities.
Transmission finally shows an asymmetry. Final prices rise more readily than they fall: once passed onto the price tag, a copper cost increase tends to stay there even when the metal recedes, as firms prefer to rebuild margins. This downward rigidity means a transient shock to the price can leave a more lasting imprint on the level of consumer prices than the metal’s path alone would suggest.
Who absorbs the extra cost depends on pricing power. Manufacturers with a strong position pass it on quickly; those facing fierce competition contain it within their margins, at least for a time. The transmission of copper to inflation is therefore not mechanical: it depends on the health of margins, the state of final demand and sectoral competition. In an economy where firms have regained pricing power, the same shock diffuses faster and more completely than in a tightly competitive environment.
Supply shock or demand shock: the decisive nuance
The most important distinction concerns the origin of the rise. Cost-push inflation, triggered by a supply shock, does not mean the same as demand-pull inflation. When the copper price rises because mine supply is constrained rather than because demand surges, inflation increases even as real activity may weaken. A New York Fed analysis (Liberty Street Economics, 27 February 2025) attributes most of the persistent global inflation surge to global supply shocks, which force central banks to trade off inflation stabilization against output. By its estimates, a more forceful tightening from mid-2021 would have lowered inflation only modestly while weighing markedly on world output. The copper rise seen through copper’s gap with its metal peers takes on its full meaning here: if it is idiosyncratic and supply-linked, it pushes prices without signaling overheating.
An indirect channel is worth adding. Even when the direct pass-through to prices stays small, a highly visible commodity spike can shift the inflation expectations of households and markets, readable in confidence surveys or in the breakeven rates derived from inflation-linked bonds. Yet expectations that come unanchored can become self-fulfilling, by feeding wage negotiations and price-setting behavior. Copper need not weigh heavily in the basket to influence the perception of inflation, and that perception matters as much as the measurement for monetary policy. Related material: our analysis of commodity price formation.
This configuration illuminates the 2025-2026 context. US inflation reaccelerated in spring 2026, from 2.4% year on year in February to 4.2% in May (BLS), driven by energy (+23.5%) more than by the rest of the basket (2.9% excluding food and energy). The presidential proclamation of 30 July 2025 adds a layer of cost: it sets a 50% tariff on imported semi-finished copper products and provides for considering a 15% duty on refined copper in 2027, then 30% in 2028. Part of the consensus reads any pickup in inflation as a symptom of robust demand; the cost channel shows this is not so when the source is a supply shock. Several forces can nonetheless cap the diffusion: substitution by other materials, productivity gains and margin compression absorb part of the extra cost before it reaches final prices.
It is this dilemma that closes the loop with the copper-gold ratio. Faced with supply-driven cost-push inflation, a central bank cannot ease decisively without risking anchoring inflation, nor tighten without deepening the slowdown. Long rates then stay high, carried by an inflation and term premium, even as growth softens. The ratio, meanwhile, can collapse because gold rises. The two series diverge not by accident, but because a metal supply shock acts at once on inflation and on the read of the cycle, exactly where the indicator assumed demand and prices moved together. A related perspective: our reading of the copper-gold ratio.
Concluding that inflation fed by a copper rise signals an overheating economy. When the source is a supply shock, cost-push inflation rises precisely as activity slows: confusing cost inflation with demand inflation leads to a misread of the actual state of the cycle. More context: a less noisy Chinese signal.
Copper therefore transmits inflation, but through a specific channel: strong and fast at the production stage, dampened and delayed at consumption, and carrying a different meaning depending on whether it is a supply or a demand shock. Reading that transmission for what it is (a shift in costs, not necessarily a growth signal) remains the condition for not misjudging what the metal’s rise says, or what it implies for rates.
Frequently asked questions
Does a copper rise push up inflation? Indirectly and partially. As an input, copper’s price first passes into producer prices, then, dampened and delayed, into consumer prices, especially during marked and durable shocks.
Why does copper weigh more on PPI than on CPI? Because it enters upstream, as a manufacturing cost. At consumption, its share in the final price is small, with most value-add residing in labor, distribution and services.
Does copper-driven inflation signal a strong economy? Not necessarily. If the rise comes from a supply shock, cost-push inflation can increase even as activity slows, the opposite of demand-pull inflation.
Last updated — 7 October 2026
Disclaimer – Financial and Legal Information: The analyses, commentary, and content published on eco3min.fr are provided for informational and educational purposes only. They do not constitute investment advice or a solicitation to buy or sell financial instruments. Past performance is not indicative of future results. All investment decisions involve risk and are the sole responsibility of the reader. Data, charts and calculated series are provided as is and may contain errors or lag behind their source: check any figure against the primary source cited before relying on it. Content describing laws, regulations or contracts reflects the law as of its publication date and does not constitute legal or tax advice; applying it to a specific situation requires a qualified legal or tax professional.
Read next
Full pillar →The Copper-Gold Ratio as a Macro Signal: Still a Reliable Gauge of Treasury Yields in 2024-2026?
The copper-gold ratio pits a growth metal against a safe haven, and for years it tracked the 10-year…
Pure-play refiners versus integrated majors: downstream margin exposure
A pure-play refiner owns only the downstream, so its earnings track the refining margin. An integrated major also…
Jet fuel, the forgotten margin: the jet crack and the aviation link
The 3-2-1 crack spread reduces the refining margin to two products, gasoline and diesel. Jet fuel sits outside…