
Gallons of gasoline one hour of US work buys, 1979 to 2026
How much gasoline an hour of median pay buys
United States, quarterly since 1979. Switch the view: the ratio, the same ratio as minutes of work, and the two inputs that move it.
Sources: BLS CPS, median usual weekly earnings of full-time wage and salary workers, not seasonally adjusted (LEU0252881500Q); BLS CPI average prices, regular unleaded, US city average, quarterly mean of the monthly series (APU000074714); via FRED. Quarterly, Q1 1979 to Q2 2026. Hourly pay = weekly median / 40 hours.
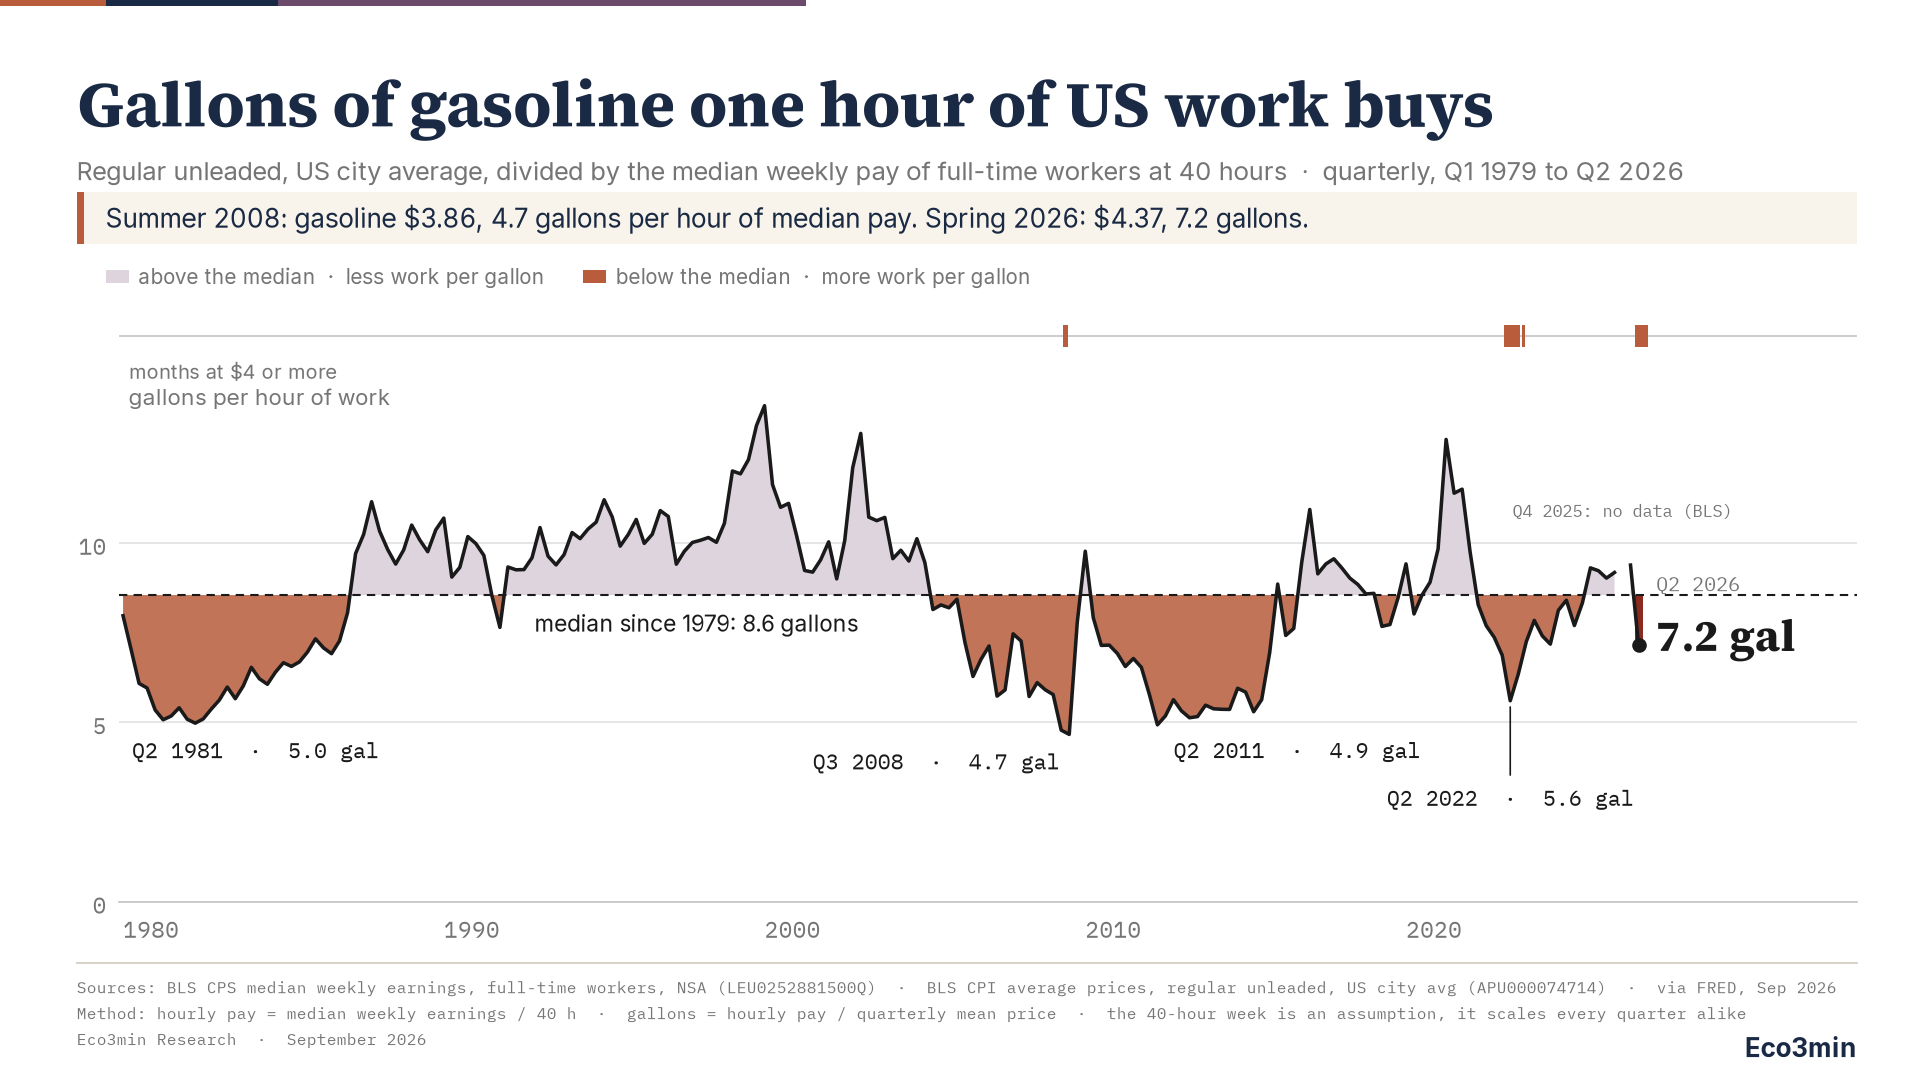
TL;DR. Gasoline averaged $4.37 a gallon in the United States in the second quarter of 2026, more than in the summer of 2008, yet an hour of median full-time pay now buys 7.2 gallons of it, against 4.7 then.
- Median weekly earnings of full-time workers were $1,251 in Q2 2026 (BLS), or $31.27 an hour at 40 hours; at $4.37 a gallon that buys 7.2 gallons. The median of the series since 1979 is 8.6.
- The four long episodes of expensive gasoline in work-time terms bottomed at 5.0 gallons (Q2 1981), 4.7 (Q3 2008), 4.9 (Q2 2011) and 5.6 (Q2 2022). Q2 2026 is the first quarter below the median since 2024.
- Between Q3 2008 and Q2 2026 the pump price rose 13 percent; median weekly earnings rose 74 percent. That gap is the whole chart.
A gallon of regular gasoline averaged $4.37 in the United States in the second quarter of 2026, and $4.20 in August, according to the Bureau of Labor Statistics. The last time a full quarter averaged above $4 was the spring and summer of 2022; before that, no quarter ever had, not even in 2008. This page asks a narrower question than “is gasoline expensive”: how many gallons does one hour of the median full-time worker’s pay buy, quarter by quarter, since 1979. The answer for Q2 2026 is 7.2 gallons. That is below the median of the series, 8.6, so gasoline is expensive by the standard of the last 47 years, and it is well above the 4.7 gallons of Q3 2008, when the pump price was lower in dollars.
The dataset behind the chart, 190 quarters of pump prices, median earnings and the resulting ratio, is available for download below. The narrow point it establishes is that the dollar price at the pump, on its own, says little about how much work a tank represents: the same $4 gallon has cost 12.9 minutes of median work and 8.4 minutes, eighteen years apart.
Key figures at a glance
Scope: United States, quarterly, Q1 1979 to Q2 2026 (190 quarters, 189 with a value; BLS produced no Q4 2025 estimate)
Metric: gallons of regular unleaded gasoline (US city average price, quarterly mean) that one hour of the median usual weekly earnings of full-time wage and salary workers buys, at 40 hours a week
Q2 2026: 7.2 gallons per hour ($4.37 a gallon, $1,251 a week, $31.27 an hour), 8.4 minutes of work per gallon
Median since 1979: 8.6 gallons per hour, about 7.0 minutes per gallon
Lowest point: Q3 2008, 4.7 gallons ($3.86 a gallon, $720 a week), 12.9 minutes per gallon
Highest point: Q1 1999, 13.8 gallons ($0.97 a gallon, $538 a week), 4.3 minutes per gallon
Months at or above $4 a gallon since 1976 (monthly series): 14, of which 2 in 2008, 7 in 2022 and 5 in 2026 (April to August)
Sources: BLS Current Population Survey, median usual weekly earnings (LEU0252881500Q); BLS CPI average price data (APU000074714); both via FRED, retrieved 19 September 2026. Eco3min calculation.
Higher price at the pump, a third less work
The pump price is the number everyone sees, and $4 has become its round-number threshold. On the BLS monthly series, regular gasoline first crossed it in June 2008, stayed there two months, crossed it again from March to August 2022 and in October 2022, and has been at or above it every month from April to August 2026. On a quarterly average, only three quarters in the series exceed $4: Q2 and Q3 2022, and Q2 2026. The summer of 2008, remembered as the year of $4 gas, averaged $3.86.
In work-time terms the two summers are not close. In Q3 2008 the median full-time worker earned $720 a week, or $18.00 an hour at 40 hours, so an hour bought 4.7 gallons and a gallon cost 12.9 minutes. In Q2 2026 the median was $1,251 a week, $31.27 an hour: 7.2 gallons an hour, 8.4 minutes a gallon. Between the two quarters the pump price rose 13 percent and median weekly earnings rose 74 percent. A gallon costs a third less work than it did, at a higher price.
The same arithmetic separates 2026 from the other expensive years. In Q2 1981, near the top of the second oil shock, gasoline averaged $1.40 and the median full-time week paid $279: 5.0 gallons an hour. In Q2 2011, at $3.82 and $753 a week, the ratio was 4.9. In Q2 2022, the quarter of the $5 peak, at $4.64 and $1,041, it was 5.6. Q2 2026, at 7.2, is expensive by the standard of the series and the mildest of the five episodes by a clear margin.
Pay is the slow variable. Across the 189 quarters the pump price has moved by more than 10 percent from one quarter to the next 44 times; median weekly earnings never have, and their largest quarterly move is under 5 percent. Every dip in the chart is a price shock that pay then absorbs over years, which is why the terracotta episodes end not when the price falls back but, often, when the median has caught up. The gap between countries, by contrast, comes mostly from pay rather than price: at the average net wage, a Big Mac takes about 7 minutes of work in Switzerland and about 63 in Mexico, although the Swiss burger costs more in dollars.
Four long episodes, and one quarter
Half of the quarters sit below the median, by construction. What matters is how they cluster. Four stretches account for most of them: Q1 1979 to Q1 1986 (29 quarters, the second oil shock and its unwinding), Q2 2004 to Q4 2008 (19 quarters, the run-up to the 2008 peak), Q2 2009 to Q4 2014 (23 quarters, the $3 to $4 plateau of the early 2010s) and Q2 2021 to Q3 2024 (14 quarters, the post-pandemic rebound and the 2022 spike). Outside those, the dips are brief: two quarters around the 1990 Gulf crisis, two in 2015, three in 2018, one in 2019.
The 2026 episode is, so far, one quarter old. Q1 2026 was comfortably above the median at 9.4 gallons; between Q1 and Q2 the quarterly pump price rose 33 percent and median weekly earnings rose 1.3 percent. Whether Q2 becomes the start of a fifth long episode or a sixth short one depends on the two inputs, and only one of them moves fast. The monthly price was $4.20 in August and the EIA weekly survey put it above $4.30 in mid-September, so the Q3 average is unlikely to be far from Q2’s; the Q3 median will be published by BLS in mid-October.
The macro backdrop is the reason the question is being asked now. The BLS consumer price index for August 2026, published on 11 September, put headline inflation at 3.4 percent over twelve months, with energy up 16.3 percent and gasoline up 27.4 percent. On 16 September the Federal Reserve raised its target range by a quarter point to 3.75 to 4.00 percent, its first increase since 2023. The usual reading of these numbers is that households face a 2008-style squeeze at the pump. The work-time series says the squeeze is real, since the ratio is below its median, but that it is about two thirds the size of 2008’s, because the pay base is different.
Two readings of the same ratio
One reading holds that 7.2 gallons an hour is a comfortable number: it is above every trough of the last 45 years, and gasoline at 8.4 minutes of median work is cheaper than in most quarters of the 2005 to 2014 decade, when the average was 6.3 gallons. On that view, the $4 headline overstates the strain because it ignores what happened to pay.
The other reading holds that the median is the wrong yardstick for a household. The 1986 to 2004 stretch, when an hour bought 9 gallons or more in 97 percent of quarters, is the period most drivers on the road today learned their expectations in, and against that baseline Q2 2026 is expensive. On that view the chart’s dips are what people feel and the dashed line is an accountant’s abstraction.
Three objections apply to both readings. First, the hourly figure rests on a 40-hour week: BLS reports the median as a weekly amount for full-time workers, defined as 35 hours or more, and the usual week of a full-time worker is close to 40. A longer assumed week would lower every point of the chart by the same proportion and change no comparison between years. The median also covers full-time workers only, so part-time earners, who are lower paid, are outside it. Second, a gallon is not a fixed quantity of driving. The Environmental Protection Agency’s Automotive Trends Report puts the real-world fuel economy of new vehicles at 27.1 miles per gallon for model year 2023, more than double the 1975 figure for every vehicle type except pickups, so the work-time of a mile has fallen faster than the work-time of a gallon. Third, the price is a national average; the same quarter is far more expensive in California than in Texas, and the series says nothing about who drives how far. Volumes lie outside it too: gasoline alone made up 43.1 percent of the oil the US consumes each day in 2025.
Methodology and sources
Primary metric. Gallons of regular gasoline that one hour of median full-time pay buys, computed each quarter as:
gallons per hour = ( median weekly earnings ÷ 40 hours ) ÷ quarterly average price of regular gasoline ($/gallon)
Minutes of work per gallon = 60 ÷ gallons per hour. The two are the same information; the chart shows gallons because more is cheaper, which reads the intuitive way.
Earnings. BLS, Current Population Survey, series LEU0252881500Q: median usual weekly earnings of full-time wage and salary workers, 16 years and over, current dollars, not seasonally adjusted, quarterly since Q1 1979. This is a median, not a mean: half of full-time workers earn more, half earn less. BLS did not produce the Q4 2025 estimate because the October 2025 survey was not collected during the lapse in appropriations; that quarter is left empty in the CSV and the chart, not interpolated.
Gasoline price. BLS, CPI average price data, series APU000074714: gasoline, unleaded regular, per gallon, US city average, not seasonally adjusted, monthly since January 1976, averaged over the three months of each quarter. The monthly series is also provided in a companion CSV, and is the basis for the count of months at or above $4. Both series were retrieved through FRED on 19 September 2026; Q2 2026 is the latest quarter with a median, August 2026 the latest month with a price.
Why a median, and why weekly. A mean hourly wage is pulled up by the highest earners and overstates what the typical worker takes home; the median is the pay of the worker in the middle. BLS publishes the median hourly wage only annually (Occupational Employment and Wage Statistics), which cannot carry a 47-year quarterly chart; it publishes the median weekly earnings of full-time workers every quarter since 1979. Converting weekly to hourly requires an assumption about hours, stated on the chart: 40. The BLS full-time threshold is 35 hours; the assumption scales every quarter identically.
Cross-check. The mean hourly earnings of production and nonsupervisory employees (BLS CES, CEU0500000008), a monthly series often used for this kind of chart, sits within 3 percent of the median-at-40-hours figure in Q2 2026 ($32.27 against $31.27) and within 1 percent in Q3 2008. The two series give the same shape; the median is used because it is the right statistic, not because it changes the answer. The mean is carried in the CSV as a secondary column. Close in this cross-check, the two statistics part ways once every employee is counted, and median versus average pay for all US workers measures that distance.
Reference line. The median of the 189 quarterly ratios, 8.55 gallons per hour. A median rather than a mean so that the 1999 and 2020 spikes do not pull the line up. Half of the quarters are below it by definition; the point of the line is to make the clustering of those quarters visible, not to define “expensive”.
Limitations. (1) National averages, for both price and pay. (2) The ratio ignores fuel economy, vehicle ownership and miles driven, all of which changed over 47 years. (3) Earnings are before tax. (4) The 1973 to 1974 shock is not covered because the earnings series starts in 1979; the 1979 to 1981 shock is.
Reproducibility. The CSV below carries every quarter’s price, median weekly earnings, hourly equivalent, gallons per hour, minutes per gallon, a below-median flag, the three monthly prices of the quarter and the source of each input. The dataset is rebuilt from the BLS series by script; no value is typed in. The chart is produced with Python (matplotlib).
Common misinterpretations
Reading the chart as “gasoline is cheap”. It is not, by the series’ own standard: 7.2 gallons an hour is below the median of 8.6. The chart says the current quarter is milder than 1981, 2008, 2011 and 2022 in work-time terms, which is a comparison between episodes, not a verdict on the level.
Reading it as a real-price chart. Deflating the pump price by the consumer price index would give a different series: it answers “what does gasoline cost relative to everything else”, whereas this one answers “what does it cost relative to an hour of median pay”. Pay and the CPI do not move together quarter to quarter, and the two charts disagree most precisely in the years when they diverge. Pay set against output per hour raises the same deflator question: on identical BLS data, the US productivity-pay gap measured under four conventions comes out at 2.55 times or 1.18 times since 1964, depending on the pay measure and the price index.
Treating the median as an average. The earnings series is the median of full-time wage and salary workers: the worker in the middle of the distribution, unaffected by what the top earns. An average hourly wage would sit higher and make every dip look shallower.
Treating the ratio as a cost-of-driving index. A gallon in 2026 moves a typical new car roughly twice as far as a gallon in 1979. The work-time of a mile has therefore fallen much more than the work-time of a gallon, and the ratio shown here is the conservative one.
Frequently asked questions
The share of spending going to motor fuel, from the BLS Consumer Expenditure Survey, is the fuller measure of the burden, but it is annual, it starts in the 1980s, and it mixes in how much people drive. The gallons-per-hour ratio isolates one thing, the pump price against median pay, at quarterly frequency over 47 years. It is a price measure, not a budget measure.
How does Q2 2026 compare with the 2022 peak?
In Q2 2022 gasoline averaged $4.64 and the median full-time week paid $1,041, so an hour bought 5.6 gallons. In Q2 2026 the price is 6 percent lower and the median is 20 percent higher, which is why the ratio is 7.2 rather than 5.6.
Is the current episode over?
The series cannot say yet. Q2 2026 is one quarter below the median, at 7.2 gallons against 8.6. The two inputs to watch are the monthly BLS pump price (the EIA weekly survey gives an earlier read) and the quarterly median in the BLS usual weekly earnings release, due in mid-October for Q3; the ratio crosses back above the median when the quarterly price falls below roughly $3.66 at the current median, or when the median rises enough at the current price.
Why does the chart start in 1979 and not at the 1973 oil embargo?
Because the BLS median weekly earnings series begins in Q1 1979. The 1979 to 1981 shock is covered; the 1973 to 1974 one is not, and no attempt is made to splice in another source for it.
Why is Q4 2025 missing?
BLS did not produce household survey estimates for the fourth quarter of 2025: the October 2025 Current Population Survey was not collected during the federal lapse in appropriations and was not collected retroactively, and a quarterly estimate cannot be computed without one of its three months. The quarter is left empty rather than interpolated.
Download the complete dataset
190 quarters, Q1 1979 to Q2 2026: quarterly price of regular gasoline, median weekly earnings of full-time workers, hourly equivalent at 40 hours, gallons per hour of work, minutes per gallon, below-median flag, the three monthly prices of each quarter, and the source of each input.
Source: eco3min.fr · BLS via FRED. Eco3min text and analysis: CC BY 4.0. Data, files and charts remain subject to their producer’s terms, stated on each page; Eco3min grants no licence over third-party data.
Conclusion
Gasoline above $4 is a headline the United States has now produced three times, in 2008, 2022 and 2026. Measured against an hour of median full-time pay, the three are different events: 4.7 gallons, 5.6 gallons and 7.2 gallons. The 2026 quarter is expensive by the standard of the last 47 years and mild by the standard of the last four price shocks, and the difference is entirely on the pay side of the ratio, which has risen 74 percent since the summer of 2008 while the pump price has risen 13 percent.
What the series cannot show is how long the current dip lasts. The four long episodes each ran for years because the price stayed high while pay caught up slowly; the short ones ended within a year because the price fell. The next quarterly prints of the same two BLS series will say which of the two this is.
Last updated — 23 October 2026
Disclaimer – Financial and Legal Information: The analyses, commentary, and content published on eco3min.fr are provided for informational and educational purposes only. They do not constitute investment advice or a solicitation to buy or sell financial instruments. Past performance is not indicative of future results. All investment decisions involve risk and are the sole responsibility of the reader. Data, charts and calculated series are provided as is and may contain errors or lag behind their source: check any figure against the primary source cited before relying on it. Content describing laws, regulations or contracts reflects the law as of its publication date and does not constitute legal or tax advice; applying it to a specific situation requires a qualified legal or tax professional.