
How much oil does the US use per day?
The US used 20.7 million barrels of petroleum a day in 2025, per the EIA, just under its 2005 peak. At that pace, the SPR would cover about two weeks.
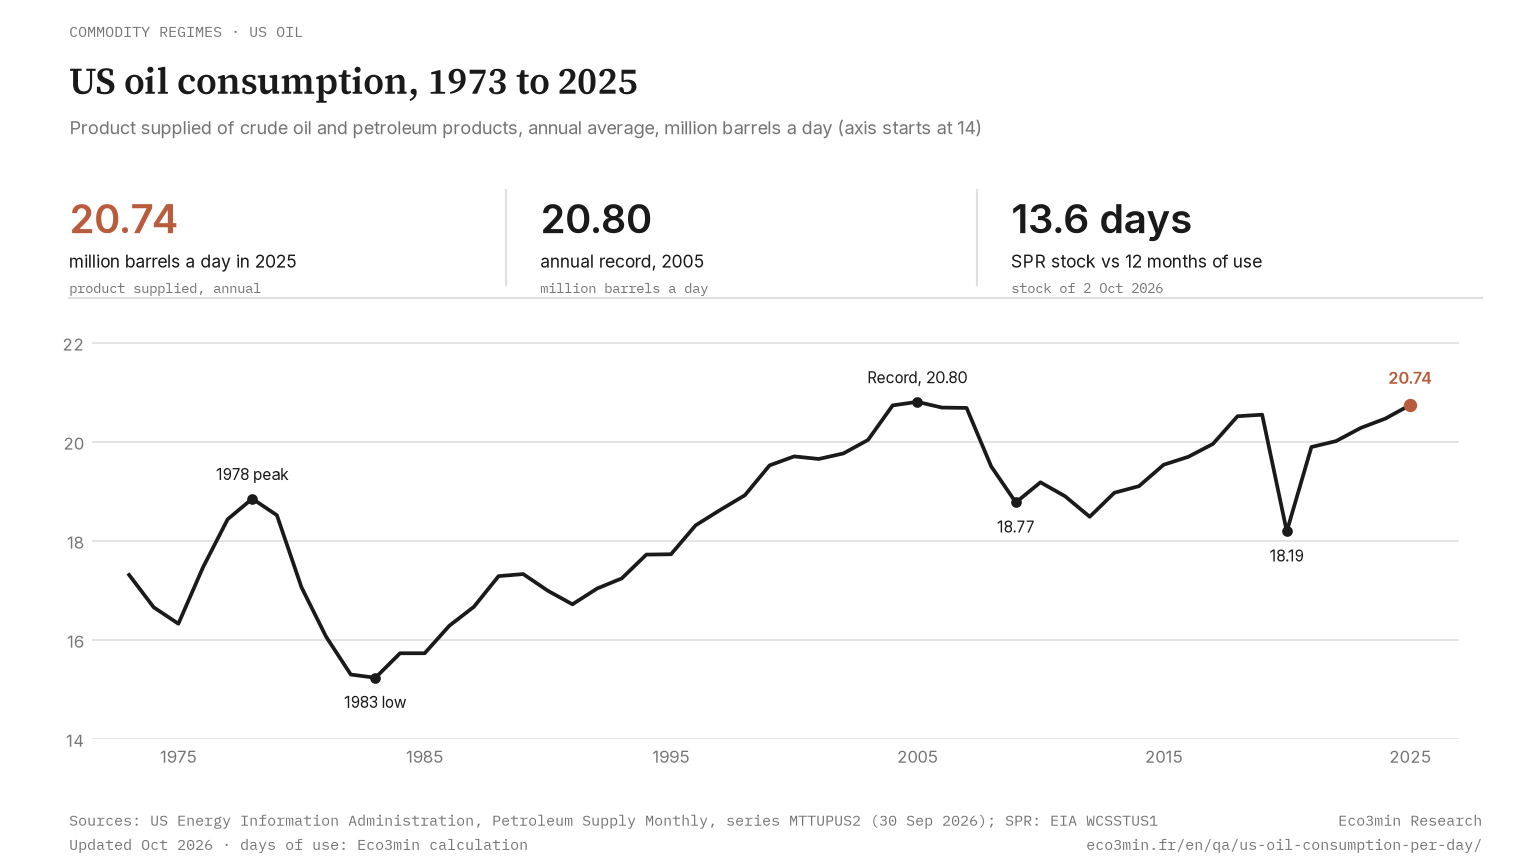
The United States consumed 20.74 million barrels of petroleum a day in 2025, according to the Energy Information Administration, just below the annual record of 20.80 million set in 2005. The figure is product supplied, the volume that leaves refineries, gas processing plants, pipelines and terminals for final use, and gasoline alone made up 43.1% of it. Set against the latest twelve months of use, the 283.0 million barrels in the Strategic Petroleum Reserve on 2 October 2026 cover about 13.6 days, a ratio rather than a supply plan.
In this article
The short answer
About 20.7 million barrels a day. The Energy Information Administration (EIA) put US consumption of crude oil and petroleum products at 20.74 million barrels a day in 2025, measured as product supplied, or about 871 million gallons. That is just below the 2005 record of 20.80 million and well above the 18.19 million of 2020.
Product supplied, the EIA’s stand-in for consumption, is the volume that leaves refineries, gas processing plants, blending plants, pipelines and bulk terminals. Over the twelve months to July 2026, it averaged 20.73 million barrels a day.
Set against that pace, the 283.0 million barrels in the Strategic Petroleum Reserve on 2 October 2026, the reserve’s lowest level since 1982, equal about 13.6 days. The emergency reserve now covers about two weeks of US consumption. That is a ratio, not a plan: the nominal maximum drawdown rate that the Department of Energy gives for the reserve, 4.4 million barrels a day, is far below daily use.
→ Trade balance: US petroleum imports and exports
What the data shows
Monthly figures appear in the EIA’s Petroleum Supply Monthly about two months late: the July 2026 reading, 20.61 million barrels a day, came out on 30 September 2026. The 2025 breakdown, in million barrels a day and as a share of the total:
- Finished motor gasoline, 8.94 (43.1%), 4.2% below its 2018 peak of 9.33.
- Hydrocarbon gas liquids, among them ethane, propane and butanes, 3.93 (18.9%).
- Distillate fuel oil, which covers diesel and heating oil, 3.91 (18.8%).
- Kerosene-type jet fuel, 1.74 (8.4%), close to its 2019 level after 1.08 in 2020.
- Residual fuel oil, 0.32 (1.6%), against 3.02 in 1978. Other products make up the remaining 1.91.
The exception is the reserve. With consumption near its record and the stock drawn down, the ratio between them is the lowest in the EIA weekly stock series, which starts in August 1982. The previous low was 17.3 days, in July 2023, and the peak 38.8 days, in February 2010 (Eco3min calculation, weekly stock WCSSTUS1 over the twelve-month average of MTTUPUS2).
→ Storage: where the reserve’s crude is stored
What drives the total, and the reserve’s yardstick
Fuels for moving people and freight. Gasoline, distillate fuel and jet fuel made up 70.3% of product supplied in 2025. Their use follows driving, trucking and flying, and the deepest dips since 2005 coincide with recessions, 18.77 million barrels a day in 2009, the lowest since 1997, and 18.19 million in 2020, the lowest since 1995. Only in 2025 did the total climb back above its 2019 level of 20.54 million.
A different barrel behind a flat total. From 2005 to 2025, consumption slipped by 66 thousand barrels a day, yet its content changed. Hydrocarbon gas liquids added 1.78 million barrels a day, from 10.3% to 18.9% of the total, more than gasoline, residual fuel oil and distillates lost together. Most HGL produced in the United States is separated from natural gas at processing plants, the EIA notes, and ethane feeds the crackers that make ethylene for plastics.
The stock answers to a different test.
A stock measured against imports. The Department of Energy reports the reserve in days of import protection. The International Energy Agency, set up in 1974 after the 1973 oil crisis, requires members to hold stocks equal to at least 90 days of the previous year’s net imports, and states that net exporters carry no minimum. In its June 2026 table of member stocks, the United States is listed as a net exporter, as it has been on EIA data in every year since 2020, by 2.85 million barrels a day in 2025.
By regime, the series splits into three periods. Through the oil shocks and the recessions of the early 1980s, consumption fell 19.2% from its 1978 peak to 1983, and residual fuel oil, burned for power, heating and ships, supplied 44% of the decline. From 1983 to 2005, years of expansion broken by the recessions of 1990–91 and 2001, it rose 36.6% to its record. Since 2005 the total has moved sideways, 0.3% below the record in 2025 after two recession dips, while the mix shifted as gas liquids for petrochemicals grew and fuel oil shrank.
The reserve is measured in days of imports, and on the IEA’s own table the United States has no net imports left to count.
→ Framework: oil, gas and copper market signals
What it means for different economic actors
Households. Gasoline is the part of the barrel most households buy directly, 8.94 million barrels a day in 2025, 4.2% below the 2018 peak. How far an hourly wage stretches at the pump is tracked in gasoline bought by an hour of work.
Investors and analysts. The weekly estimate comes first but swings widely, from 21.50 million barrels a day in the week to 25 September 2026 to 20.40 million a week later. The total also mixes fuels with petrochemical feedstocks, so a demand signal read from it partly reflects chemical plants, with gas liquids at 18.9% of product supplied in 2025.
Energy-security planners. The Department of Energy rates the reserve’s nominal maximum drawdown at 4.4 million barrels a day, or 21.2% of 2025 consumption. It says oil reaches the market 13 days after a presidential decision.
The usual misreading takes 13.6 days as the time the country could run on its reserve. The ratio assumes every other source of supply stops, while US crude output alone averaged 13.66 million barrels a day in 2025 and the country exported more petroleum than it imported.
Practical observation
What the data suggests for understanding your situation:
- Question to ask yourself: when a figure says the US holds so many days of oil, is the divisor consumption, net imports or the rate at which the reserve can be drawn?
- Data to monitor: the four-week average of weekly product supplied, 21.05 million barrels a day to 2 October 2026 against 20.90 million a year earlier (up 0.7%), which smooths week-to-week swings.
- Historical parallel: the reserve reached its full authorized capacity of 727 million barrels on 27 December 2009, according to the DOE, and covered about 38.8 days of consumption in February 2010, almost three times today’s ratio.
- What the literature documents: Hughes, Knittel and Sperling (NBER Working Paper 12530, 2006) estimate the short-run price elasticity of US gasoline demand at −0.034 to −0.077 over 2001–2006, against −0.21 to −0.34 over 1975–1980, a demand grown far less sensitive to prices.
This is descriptive information to help you frame your own analysis. Eco3min does not provide investment advice.
Go deeper
📁 Dataset: US retail gasoline prices since 1990
📖 Related analysis: the oil burden and US recessions
Related questions
Frequently asked questions
How many days of oil does the US have?
It depends on the divisor. Against the latest twelve months of consumption, the 283.0 million barrels of 2 October 2026 equal 13.6 days. At the nominal maximum drawdown rate, they represent about 64 days of releases. The Department of Energy counts in imports instead. At the end of 2025, with 411 million barrels in the reserve, it put protection at about 125 days of crude oil net imports, without giving the import figure behind it. Divided by the EIA’s 2025 average of crude oil net imports, 2.21 million barrels a day, the same stock covers about 186 days (Eco3min calculation). The IEA’s 90-day test, which nets crude and products together, sets no floor for a net exporter.
Does US oil consumption include products made from natural gas?
Yes. Product supplied includes 3.93 million barrels a day of hydrocarbon gas liquids in 2025, and most HGL produced in the United States is separated from natural gas at processing plants, according to the EIA. Finished gasoline also contains the fuel ethanol blended into it, which the EIA records as an input of refiners and blenders. Crude oil itself enters product supplied only when it is burned as fuel on leases and by pipelines.
Why does the weekly figure differ from the monthly one?
Weekly estimates come from the EIA’s weekly surveys of refineries, terminals, pipelines and importers, and are labelled petroleum products only, where the monthly series adds crude oil, counted when it is burned as fuel. The weekly record, 23.19 million barrels a day in the week to 10 December 2021, sits above anything a calendar month has posted, the monthly record being 21.67 million, in August 2005.
Last updated — 9 October 2026
Disclaimer – Financial and Legal Information: The analyses, commentary, and content published on eco3min.fr are provided for informational and educational purposes only. They do not constitute investment advice or a solicitation to buy or sell financial instruments. Past performance is not indicative of future results. All investment decisions involve risk and are the sole responsibility of the reader. Data, charts and calculated series are provided as is and may contain errors or lag behind their source: check any figure against the primary source cited before relying on it. Content describing laws, regulations or contracts reflects the law as of its publication date and does not constitute legal or tax advice; applying it to a specific situation requires a qualified legal or tax professional.