
What is the median salary in the US, and how far is the average above it?
The median US wage was $50,980 a year in May 2025 per the BLS OEWS, against an average of $69,770. Full-time workers' median pay: $1,251 a week in Q2 2026.
The median US wage was $50,980 a year in May 2025 across all jobs, part-time included, according to the BLS Occupational Employment and Wage Statistics survey, against an average of $69,770. The average sits above the median because a minority of high earners lifts it: in Social Security W-2 records for 2023, 67.6% of wage earners received no more than the average of $63,933. Counting only full-time workers, the BLS puts the median at $1,251 a week in the second quarter of 2026, and in 2023 the full-time median over 52 weeks, $58,084 on an Eco3min calculation, was about $15,000 above the median of all W-2 earners.
In this article
The short answer
It depends on which federal survey answers. Counting every wage and salary job, part-time included, the BLS Occupational Employment and Wage Statistics (OEWS) put the median at $50,980 a year in May 2025, or $24.51 an hour. Counting only full-time workers, the Current Population Survey (CPS) puts it at $1,251 a week in the second quarter of 2026.
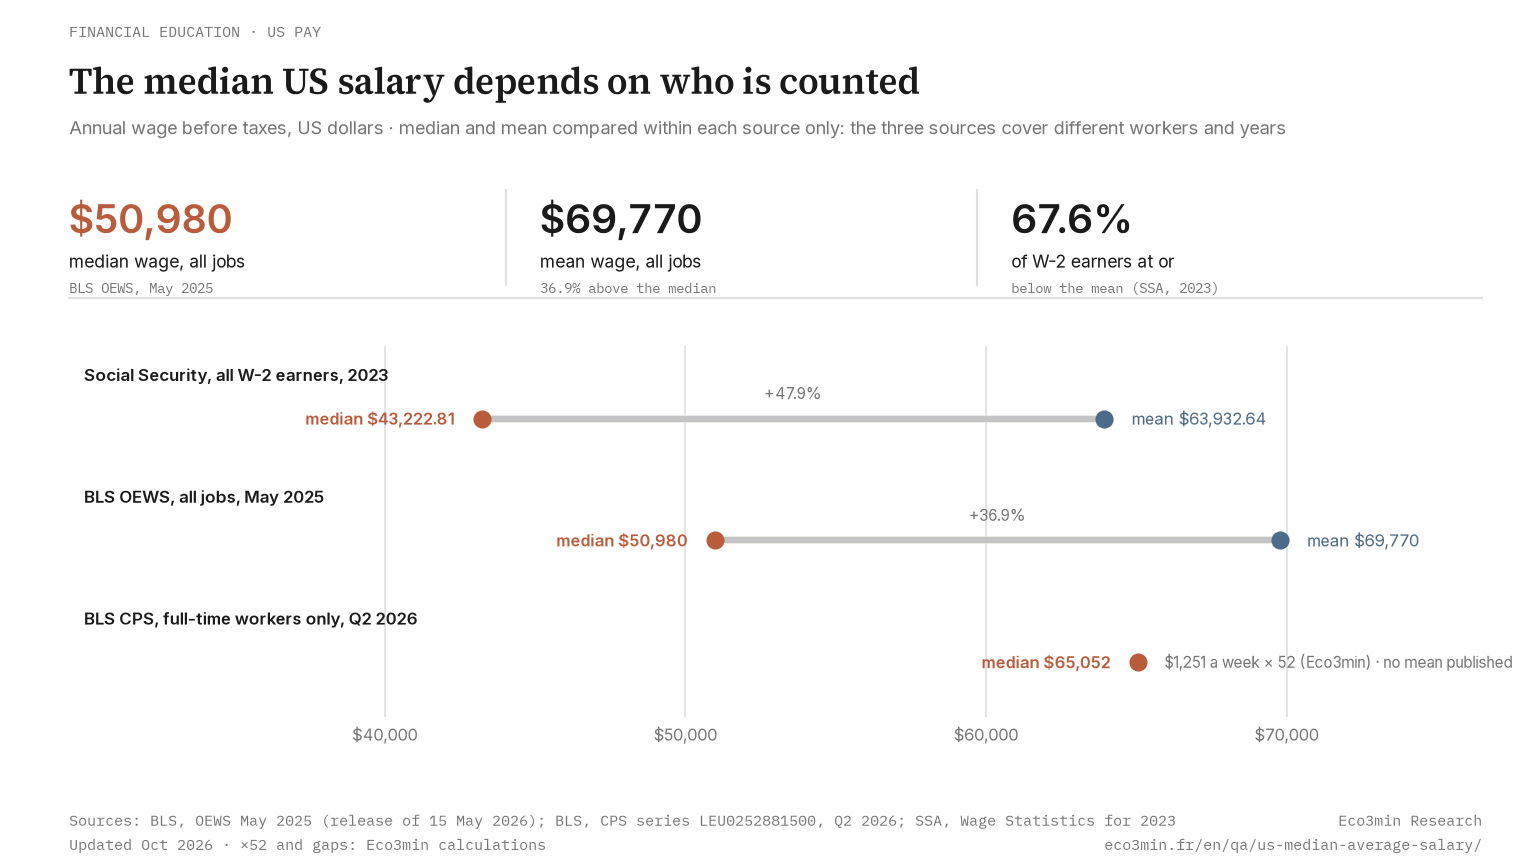
The average is higher in every source that publishes both. OEWS gives a mean of $69,770, and Social Security W-2 records for 2023 give $63,932.64 against a median of $43,222.81. Read as a typical salary, the average misleads, since 67.6% of the 173.7 million wage earners in the SSA data were at or below it.
Multiplied by 52, the full-time weekly median gives $65,052 a year, an Eco3min calculation the BLS does not publish. The latest readings span about $43,000 to $65,000, across three different years. Which median depends on who counts as a worker.
→ A different measure: why average household income sits so far above the median
What the data shows
Four federal statistics measure pay, each on its own population and in its own unit. The latest readings, before taxes and deductions:
- CPS, full-time workers: a median of $1,251 a week in the second quarter of 2026 for 120.9 million people, 4.6% above a year earlier against 3.9% for CPI-U inflation (BLS release of 21 July 2026). The lowest-paid tenth earned $642 or less, the top tenth $2,924 or more.
- OEWS, all jobs: a mean of $69,770 and a median of $50,980 in May 2025, over 155.5 million jobs (BLS release of 15 May 2026). Per month, an Eco3min division by twelve gives $5,814 and $4,248.
- Social Security, all W-2 earners: a raw average of $63,932.64 and a median of $43,222.81 in 2023 (SSA, average and median net compensation).
- CES, private payrolls: average weekly earnings of $1,300.66 in September 2026, preliminary (BLS Employment Situation). This survey publishes no median.
→ Dataset: US real wage growth, monthly since 2007
Why the median and the average diverge
Three things separate the figures quoted as the US salary: the shape of the distribution, the population counted and the way a year is built.
A long upper tail. Pay is bounded at zero and open-ended above, so the highest earners raise the mean without moving the median. In the CPS the top tenth starts at 2.3 times the median, while the bottom tenth stops at about half of it. On an Eco3min calculation the mean exceeds the median by 36.9% in OEWS and by 47.9% in SSA data, which record every dollar reported for federal income tax.
Who counts as a worker. The CPS median covers people who usually work 35 hours or more a week at their main job; OEWS counts jobs, part-time ones included. The SSA counts everyone who received a W-2, from the summer job to the executive. The usual shorthand of one US median salary hides how far apart these groups sit: in 2023, the full-time median over 52 weeks came to $58,084, against $43,222.81 for all W-2 earners, about $15,000 apart in the same year.
Then the calendar.
How a year is built. OEWS multiplies every hourly wage by 2,080 hours, so part-time jobs pull its median down through their lower hourly rates, not through fewer hours. The SSA records what was actually paid, so fewer hours and fewer weeks lower it directly. The latest readings also come from 2023, 2025 and 2026: about $7,000 of the gap between the lowest and the highest reflects nominal wage growth over those years.
Over time, the full-time median has moved by regime. In 1982-84 dollars and annual averages, it held between $312 (1981) and $345 (2009) a week from 1979 to 2014, during three decades of disinflation, and reached $359 in 2019 (BLS series LEU0252881600). It jumped to $380 in 2020, a record the BLS partly attributed to pandemic job losses among lower-paid workers, then fell back to $362 in 2022. A real median falls when CPI-U inflation outpaces nominal pay, the gap between nominal and real wages, and the return of lower-paid workers to jobs, the mirror image of 2020, is one possible second channel. It stood at $374 in the second quarter of 2026. The parameters that separate these regimes are the gap between pay growth and inflation and, in recessions, who keeps a job.
In the same year, the median US full-time worker earns about $15,000 more than the median of everyone paid a wage.
→ Framework: everyday financial trade-offs across regimes
What it means for different economic actors
Employees and job seekers. A pay offer set beside the average salary is set beside a figure that two W-2 earners in three do not reach. The CPS gives closer reference points for full-time work: $1,380 a week for men and $1,131 for women (82.0%), and, at 25 and over, $803 without a high school diploma, $994 with one and $1,768 with at least a bachelor’s degree.
Employers and analysts. The CES average of $1,300.66 a week is a private-payroll mean that includes part-time hours, so it does not line up with the CPS full-time median. Pay can also be read in what an hour of work buys, as with gallons of gasoline per hour of US work.
Social Security. The SSA national average wage index, $69,846.57 for 2024, is not that year’s raw average wage ($67,027.24): each year’s index is the previous one multiplied by the change in the raw average. Published in the Federal Register on 3 November 2025, it lifted the 2026 taxable maximum to $184,500 (SSA wage index series).
A common error is to set a weekly CPS median beside an annual OEWS mean. The two differ in population, unit and survey, and the gap between them says nothing about inequality.
Practical observation
What the data suggests for understanding your situation:
- Question to ask yourself: is the salary quoted a full-time weekly median, an annual median across all jobs, a W-2 median or a mean, and is the figure it is compared with of the same kind?
- Data to monitor: the CPS release of 21 October 2026 for the third quarter, and in it the constant-dollar median ($374 in 1982-84 dollars in the second quarter), whose direction says whether pay is outrunning prices.
- Historical parallel: in SSA data the mean ran 38.8% above the median in 1991 and 54.7% in 2021, the widest gap since the series began, before narrowing to 47.9% in 2023 (Eco3min calculations on SSA averages and medians).
- What the literature documents: the Atlanta Fed Wage Growth Tracker follows the same individuals 12 months apart in CPS microdata and reports the median change in their hourly wage, so a shift in who is employed does not enter the measure the way it enters the 2020 median.
This is descriptive information to help you frame your own analysis. Eco3min does not provide investment advice.
Go deeper
📊 Full study: real US household income by percentile, 1967 to 2025
📖 Related analysis: the productivity-pay gap under four conventions
Related questions
Frequently asked questions
How does the BLS turn a weekly median into an annual salary?
For the CPS it does not. The release reports usual weekly earnings and contains no annual equivalent. Multiplying $1,251 by 52 gives $65,052, or $5,421 a month, but that assumes a full year of paid weeks and is an Eco3min calculation. Only the SSA figures are amounts actually received over a calendar year.
Why do official median salaries range from about $43,000 to $65,000?
Because each one draws its line around a different group. The lowest, $43,222.81 in 2023, counts every W-2 earner, including people who worked a few weeks or a few hours. The OEWS median of $50,980 counts jobs at their hourly rate on a full-time schedule. The highest, $65,052 on the 52-week calculation, keeps only people working 35 hours or more. Part of the range is calendar, since the three readings date from 2023, 2025 and 2026; at equal year, 2023, the full-time and W-2 medians still sit about $15,000 apart.
Why is there no CPS earnings figure for late 2025?
The October 2025 survey was not collected during the federal government shutdown, and the BLS did not produce fourth-quarter estimates. The series runs from $1,214 a week in the third quarter of 2025 straight to the first quarter of 2026. The 2025 annual median of $1,204 averages eleven months, which the BLS flags as not strictly comparable with $1,159 for 2024.
Last updated — 9 October 2026
Disclaimer – Financial and Legal Information: The analyses, commentary, and content published on eco3min.fr are provided for informational and educational purposes only. They do not constitute investment advice or a solicitation to buy or sell financial instruments. Past performance is not indicative of future results. All investment decisions involve risk and are the sole responsibility of the reader. Data, charts and calculated series are provided as is and may contain errors or lag behind their source: check any figure against the primary source cited before relying on it. Content describing laws, regulations or contracts reflects the law as of its publication date and does not constitute legal or tax advice; applying it to a specific situation requires a qualified legal or tax professional.
Regulated and tax values: the rates, indices, caps and brackets with legal effect cited on this page are set by official decision, change over time and apply according to individual circumstances. Only the official publication in force on the relevant date is authoritative (for example the Journal officiel, INSEE, Banque de France, the IRS or the Social Security Administration). To revise a rent, sign or challenge a contract, or file a return, check the value at the source or with a professional.