Financial Education and Wealth Sequencing: Why the Order of Decisions Drives Fragility
Household fragility correlates more with the sequence in which financial decisions are taken than with the products chosen. A sequencing-based reading of financial education identifies four functional steps and three coherence indicators observable in long-run balance sheet data.

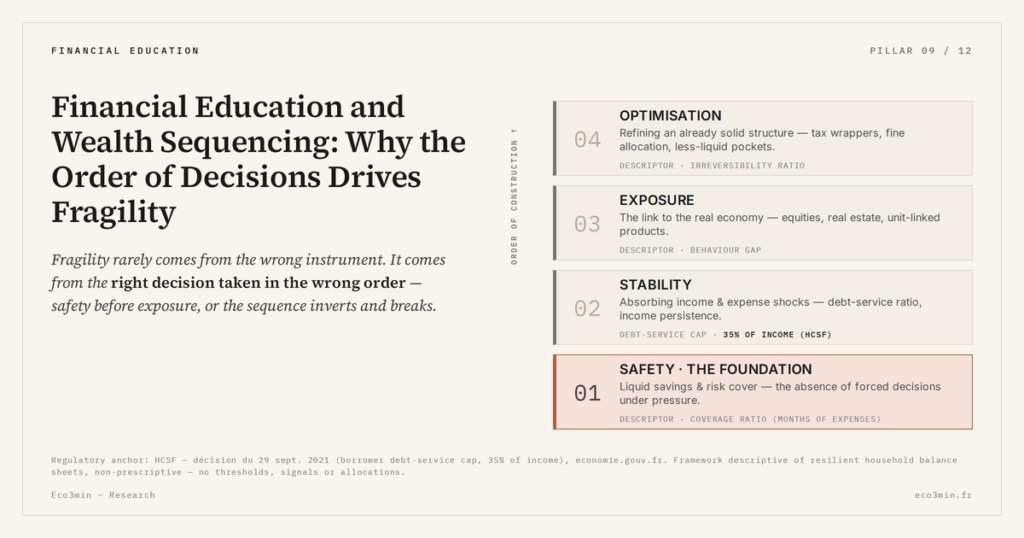
Household financial fragility rarely originates in a single bad choice. It originates in the order in which choices are made — a sequencing dimension that conventional financial education tends to leave outside the frame.
Financial education is typically framed as a catalogue of instruments: save regularly, diversify, invest for the long term. That framing misses the operational variable. In real wealth trajectories, fragility rarely stems from a single misjudged choice, but from an incoherent sequence — individually rational decisions whose combination over time creates vulnerability.
TL;DR
In resilient household balance sheets, four functions recur in a fixed order — safety, stability, exposure, optimisation — and most documented fragility traces to inverting that sequence.
- More than 70% of households report grasping day-to-day money management (INSEE, ECB, OECD surveys 2024–2025), yet euro-area data for 2025 show nearly 40% of retail product subscriptions in risk-bearing instruments against median liquid savings of under three months — exposure built ahead of safety.
- France's HCSF caps new-mortgage debt service at 35% of income, the level where BIS and ECB micro-data show default frequency climbing sharply; households entering Banque de France distress procedures hold, on average, under one month of expense coverage at the triggering shock.
The relevant question is not what to do, but in what order things actually get done. The same financial instrument can strengthen or weaken a household balance sheet depending on where it appears in the trajectory. That time dimension — decision sequencing — remains the neglected core of financial education, even though it is its operational heart. More on this: Financial Leverage and Personal Finance Education: The Diffuse Risk.
The figures are telling. According to household financial literacy surveys (INSEE, ECB, OECD, 2024–2025), more than 70% of households report understanding the fundamentals of day-to-day financial management. Vulnerabilities nonetheless persist: heavy reliance on consumer credit, insufficient emergency savings, and poorly calibrated risk-taking. Consolidated euro area banking data show that in 2025, nearly 40% of retail financial product subscriptions involved risk-bearing instruments, while median liquid savings covered less than three months of recurring expenses. The paradox points away from access-to-information explanations: the issue is not the volume of knowledge, but the ordering of decisions. A sequencing error is not an information deficit, which is exactly what explains the weak behavioural effect of financial literacy programmes.
The reading developed here fits within a broader analysis of how individual decisions interact with the macroeconomic environment, detailed in the work on real policy rates and their implications for asset valuations. Household financial decisions never operate in a vacuum: they are embedded in regimes of interest rates, growth, and volatility that materially shift the relevance of a given choice over time. The analytical framework that anchors this reading is developed in the study on everyday financial tradeoffs across economic regimes.
The framework presented below is descriptive, not prescriptive. It maps the four functional steps observed empirically in resilient household balance sheets — safety, stability, exposure, optimisation — and the failure modes documented when those steps are inverted. It does not produce thresholds, signals, or recommended allocations.
Why the order of decisions creates or destroys wealth value
Wealth sequencing is not an abstract construct. It is a concrete mechanism whose effects compound over time and only become visible during shocks. Four functional steps describe the structure observed across resilient household balance sheets in long-run survey data.
Safety — the invisible foundation. Financial safety covers immediately available liquid savings and the coverage of major risks through insurance. It generates little financial return, but it preserves something more valuable: the absence of forced decisions under pressure. Households retaining several months of recurring expenses in liquid form during an income shock historically display lower forced-liquidation rates on investment portfolios. The protective function defines the value of emergency savings — not the headline yield of the account holding them.
Stability — the capacity to absorb volatility. Stability captures the household’s ability to absorb moderate income or expense shocks without disrupting its overall balance. Concretely, it shows up in debt-service ratios, in income persistence, and in the matching of debt structure to repayment capacity. The Haut Conseil de stabilité financière (HCSF) in France caps household debt-service ratios at 35% of income — a regulatory ceiling that documents the level at which observed default frequencies rise sharply across BIS and ECB micro-data, not a comfort threshold. Fixed-rate mortgages anchor stability; variable-rate consumer credit erodes it. The function is not spectacular, but it is what allows balance sheets to ride through cycle fluctuations without unwinding the rest of the structure.
Exposure — the link to the real economy. Exposure connects households to economic dynamics and financial markets through diversified equity instruments, rental real estate, or life insurance unit-linked products. The function only delivers when the first two steps are in place: insufficient safety converts ordinary shocks into forced sales, and insufficient stability compromises the capacity to hold exposure across cycles. Dalbar’s QAIB (2025) reports an average equity-fund investor return of roughly 6.5% per year against 10% for the S&P 500 — a 3.5-point gap largely traced to timing errors (selling at cycle troughs, buying at peaks). The lack of pre-existing safety buffers is one of the documented drivers of those forced sales. The analysis of investment discipline across market regimes details that mechanism.
Optimisation — the refinement of an already solid structure. Optimisation improves the efficiency of an existing well-structured balance sheet: tax envelopes (PEA, life insurance wrappers), fine-grained allocation, exposure to less liquid pockets (private equity, real estate funds, timberland). The function operates on the margin, and only operates meaningfully once the first three steps are in place. Optimising taxes on a portfolio that lacks emergency savings is the operational equivalent of painting a house whose foundations remain unfinished. Background: Euro Funds in Life Insurance: Still Useful in 2026.
What the dominant framing misses
The dominant approach to financial education assumes that disseminating simple rules suffices to improve behaviour: “save 10% of your income”, “diversify your portfolio”, “invest early”. The rules are not wrong. They are incomplete, because they handle instruments without handling sequencing. Telling someone to “invest early” without first checking emergency savings and debt structure invites building an upper floor without foundations.
The pedagogical consensus assumes that poor outcomes reflect a lack of information. The data points to a different hypothesis: decisions are often individually rational but collectively incoherent across time. Each choice may make sense locally — opening a tax-advantaged equity account, buying an ETF, subscribing to a unit-linked life insurance product. Their combination over time generates the vulnerability. A household investing in equities before building emergency savings is not making a product-selection mistake — it is making a sequencing mistake. The investment decision is sound; its timing is not.
The shift in perspective — from choices to the sequence of choices — reframes what financial education is meant to address. The relevant analytical question becomes: at which step of the sequence does this balance sheet currently sit, and does the next decision respect or violate that order? Misleading economic indicators and market narratives (“invest now before it’s too late”) consistently push individuals to skip steps — a trap rendered more effective by the fact that each individual argument is locally valid.
Investing in risk-bearing assets (equities, ETFs, crypto, real estate funds) before liquid savings cover several months of recurring expenses. The dynamic is documented in the analysis of primary residence, savings and investing as distinct wealth functions. Inverted sequencing produces invisible fragility: at the next unforeseen event (job loss, urgent expense, separation), the investment must be liquidated in potentially unfavourable market conditions. Expected investment returns are then absorbed by forced selling — precisely the mechanism captured by Dalbar’s documented behaviour gap (3.5 points/year lost). The driver is not poor product selection — it is poor timing within the wealth sequence.
| “Instrument catalogue” framing | Sequencing framing | |
|---|---|---|
| Core question | What is the best investment? | Which step of the sequence does this balance sheet sit at? |
| Identified source of error | Lack of information | Poor prioritisation across time |
| Success metric | Return of the selected product | Coherence of the sequence and structural robustness |
| Shock protection | Instrument-level diversification | Respect of the safety → stability → exposure order |
| Main trap | Choosing the wrong product | Choosing the right product at the wrong point in the sequence |
When the macro context amplifies sequencing errors
The sequencing framework is structural — it remains relevant across cycles. Certain macroeconomic environments nonetheless amplify the cost of sequencing errors, and the current cycle is one of them.
The 2022–2025 regime shock as a stress test. Between 2022 and 2025, the abrupt shift from near-zero policy rates to levels of 4% to 5% in advanced economies inverted the implicit hierarchy of financial trade-offs, as documented by ECB studies on monetary transmission to households. Choices that previously looked harmless — variable-rate borrowing, investing all available savings, purchasing property at the maximum borrowing capacity — turned penalising. The regime shift surfaced fragilities that had remained invisible for years: households with incoherent sequencing (exposure without safety, leverage without stability) absorbed the impact first. The examination of the role of real interest rates clarifies why the same nominal rate level can be accommodative or restrictive depending on inflation — and why household decisions cannot be read in nominal terms alone.
Compressed margins for error. In early 2026, European growth projections stand between 0.8% and 1.2%, INSEE-reported core inflation hovers around 2.6%, and credit conditions remain restrictive. Margins are tightening: decisions taken without prior safety buffers become more costly to correct. France’s Livret A account at 2.4% delivers a slightly negative real return — a configuration that pushes some savers towards riskier assets, at the cost of weakening the safety function. The pattern captures one of the most common sequencing errors observed in the current cycle: skipping the safety step to move directly to exposure, drawn by the headline return.
Information overload as amplifier. A common thesis holds that democratised access to financial information will gradually reduce household errors. Behavioural evidence points the other way: information overload amplifies confusion when the prioritisation framework is missing. Social media, financial influencers, and low-cost trading platforms widen access to instruments — and they widen the incentive to skip safety steps in favour of direct exposure. The bottleneck is no longer instrumental knowledge but the lens that orders it — something raw information alone cannot supply.
Three indicators that describe sequence coherence
Sequence coherence is not an abstract notion. It translates into three observable indicators that describe — without prescribing — where a household balance sheet sits along the safety–exposure axis.
Coverage ratio. The number of months of recurring expenses (housing, food, transport, insurance, subscriptions) covered by immediately available savings. Banque de France over-indebtedness data show that households entering financial distress procedures display, on average, coverage ratios below one month at the moment of the triggering shock. The indicator describes resilience capacity, not a target. For context: The 50/30/20 Budget: Resilience in a High-Rate Era.
Debt-service ratio. The share of income absorbed by debt repayment (mortgage and consumer loans combined). France’s HCSF caps the ratio at 35% on new mortgage originations, a level historically associated with a sharp rise in default frequency in BIS and ECB studies. The ratio is the most direct descriptor of the capacity to hold the wealth structure together during shocks.
Irreversibility ratio. The share of financial commitments difficult to unwind in the short term — mortgages, real estate funds with lock-up clauses, private equity with multi-year holding periods. The ratio does not judge whether commitments are good or bad. It measures the residual degree of freedom available when circumstances change.
These three indicators do not forecast outcomes. They position a household trajectory along the safety–exposure axis, irrespective of the instruments used, and help identify whether the next financial move respects or violates the underlying sequence.
Sequencing patterns observed across household segments
Survey and bank data document recurring sequencing patterns across household segments — patterns described here as empirical regularities, not as profile-targeted recommendations.
Early-career segment. Households at the beginning of their working life typically operate at the safety step. The dominant sequencing failure documented in social-platform-driven retail flow data is direct exposure (equity ETFs, crypto, leveraged products) without the prior liquid buffer — drawn by the visibility of recent returns. The mechanical consequence in cycle downturns is forced selling at troughs, which absorbs the long-duration premium that justified the exposure in the first place.
Recent-mortgage segment. Households that have recently entered a mortgage operate primarily at the stability step. In the current cycle (mortgage rates around 3.5% to 4%), the monthly debt service represents a structurally heavier burden than during the 2010–2020 decade. The recurring sequencing failure observed in Banque de France data is the depletion of liquid savings into the down payment, leaving no residual safety buffer post-purchase — a configuration where any subsequent income shock converts into forced asset sales or distress refinancing.
Mid-life established-wealth segment. Households that have completed the first three steps typically operate at the optimisation step. The recurring sequencing failure here is the multiplication of optimisation vehicles (tax envelopes, real estate funds, private equity, complex life insurance wrappers) without periodic reassessment of foundational strength. Sophistication then masks structural fragility: emergency savings erode in real terms, debt structures lengthen, and the irreversibility ratio rises silently.
Invalidation conditions. The sequencing framework loses its operational relevance under two conditions documented historically. First, a durably anchored negative-real-rate regime, which collapses the opportunity cost of liquid safety and weakens the discipline imposed by the order. Second, institutional mechanisms that automatically reinforce household financial safety nets (broad universal income, expanded unemployment insurance), which substitute for individual buffer accumulation. Cyclical rebounds can temporarily mask sequencing weaknesses without resolving them.
Three horizons across which the framework operates
Short horizon (0–6 months). The three coherence indicators (coverage, debt-service, irreversibility ratios) describe where the balance sheet sits today. Households whose coverage ratio falls below a few months typically display higher forced-liquidation rates on investment portfolios during cyclical shocks, regardless of how those portfolios are constructed.
Medium horizon (1–3 years). Automated savings and investment processes (regular transfers to regulated savings, then to a tax-advantaged equity account) have been documented to reduce the frequency of step-skipping under market-narrative pressure. The interaction with the economic cycle determines whether the macro environment amplifies or compresses the cost of sequencing errors.
Long horizon (5 years and beyond). The three ratios shift with life-cycle events (income changes, childbirth, property purchase, inheritance) and with macro cycles (rates, inflation, credit conditions). Sequencing is therefore not a static checklist but a lens applied to each new financial decision across time. The weekly macro update and the hub dedicated to financial education across macro regimes provide a coherent monitoring framework.
Household financial fragility is a sequencing variable before it is a product-selection variable. Activity indicators on wealth — returns, holdings, allocations — measure its delayed consequences.
Structural. The sequencing principle — safety before exposure — is anchored in behavioural finance (Kahneman, Thaler) and in empirical work on the behaviour gap (Dalbar, Morningstar). The impact of forced selling driven by insufficient liquid buffers on long-run portfolio returns is documented across more than thirty years of investor-level data. The link between elevated debt-service ratios and balance sheet fragility during shocks is confirmed in Banque de France over-indebtedness studies.
Context-dependent. The exact level of liquid savings that produces resilience depends on income volatility and family structure — no universal number applies. Expected future returns across asset classes are inherently uncertain. The cyclical environment (rates, inflation, credit conditions) modulates the cost of sequencing errors over time. The indicative orders of magnitude associated with the three coherence ratios depend on individual circumstances.
- Across long-run household balance sheet data, fragility correlates more strongly with the order in which decisions were taken than with the quality of individual product choices.
- Four functional steps describe resilient sequencing observed empirically: safety, stability, exposure, optimisation. Each step performs a function the following ones depend on.
- The current macro regime — restrictive real rates, weak growth, persistent inflation — compresses the margin for sequencing errors, amplifying the cost of inversion.
- Three observable indicators — coverage ratio, debt-service ratio, irreversibility ratio — describe where a household balance sheet sits along the safety–exposure axis without producing thresholds for action.
- The framework’s relevance weakens under durably negative real rates or under institutional safety nets that substitute for individual buffer accumulation.
The sequencing reading underpins the broader analysis developed across the work on financial education across macroeconomic regimes. It does not deliver an optimal allocation. It provides the lens through which the next financial decision can be situated within its trajectory, regardless of amount, product, or cycle phase. The steps of that trajectory are unpacked, stage by stage, in the analyses below.
In this series
Compound interest, without the myths
Discipline and sequencing
Together they map the decision order examined in this article.
Last updated — 30 July 2026
Disclaimer – Financial Information: The analyses, commentary, and content published on eco3min.fr are provided for informational and educational purposes only. They do not constitute investment advice or a solicitation to buy or sell financial instruments. Past performance is not indicative of future results. All investment decisions involve risk and are the sole responsibility of the reader.
Read next
Full pillar →Where the Livret A’s Money Goes: The Caisse des Dépôts Circuit and Social-Housing Finance
The savings held on Livret A accounts do not sit idle. A regulation-set share is centralised at the…
France’s LEP vs the Livret A: A Means-Tested Higher Rate, Explained
France’s Livret d’épargne populaire is often described as "the Livret A, only better". The description misleads: the LEP…
France’s Livret A Ceiling: What Happens Mechanically When a Capped Savings Account Is Full
France’s Livret A ceiling, €22,950, is one of the best-known figures in French saving and one of the…