
The TTF–Henry Hub Spread: Measuring Europe’s Energy Cost Gap with the US

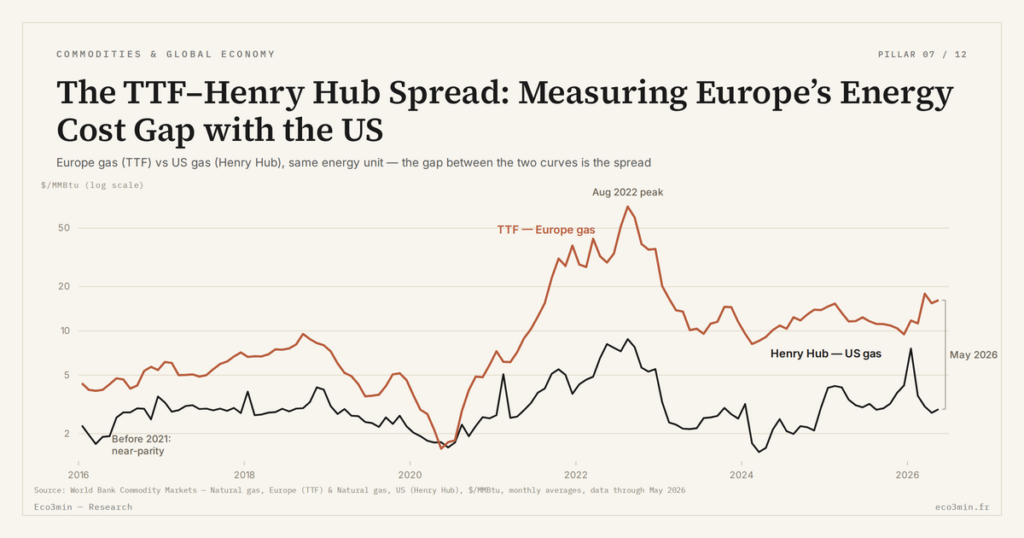
The gap between European TTF and US Henry Hub — the transatlantic gas spread — captures, in a single magnitude, the energy cost differential between the two large industrial zones of the Atlantic.
TL;DR
The TTF-Henry Hub spread condenses transport, supply, capacity and carbon costs into one figure that reads as a competitiveness gauge once both prices share a common energy unit.
- Henry Hub averaged $2.21/MMBtu in 2024, its lowest real price on record per the EIA, against $6.45 in 2022; a low US denominator widens the spread even with TTF unchanged.
- A fourth, often-omitted component runs against Europe: the EU emissions trading system adds a carbon charge to European energy that the US market does not yet carry.
- An oil-style reading treats a wide spread as temporary dislocation; a gas-appropriate one treats it as structural, since the transport constraint gives gas no mechanical path back to equilibrium.
Rather than an isolated price level, it is this gap that carries the decisive information. This piece decomposes what it measures, how it is computed, and why it reads as a competitiveness gauge.
A gap between two benchmarks, not a price
The TTF–Henry Hub spread is not a price: it is the distance between two prices. TTF, the Dutch hub, serves as the benchmark for European gas; Henry Hub, quoted in Louisiana, for North American gas. Subtracting one from the other yields a single measure of the gas cost gap between the two shores. Because these two markets are structurally separate — the whole meaning of the absence of a world gas price — that gap is not a passing anomaly but a durable magnitude, worth tracking in its own right.
The analytical value lies in what the spread condenses, in one figure, of a cluster of factors: transport costs, supply-demand balances on each side, available physical capacity, regulation. Rather than tracking each of these variables separately, one reads their resultant. For anyone wishing to reconstruct the gap over time, the TTF price history and the Henry Hub price record provide the two series to compare.
A warning is needed at once. Subtracting two prices assumes they are expressed in the same unit, which is not the case for gas: TTF is quoted in euros per megawatt-hour, Henry Hub in dollars per million BTU. Comparing the raw levels therefore makes no sense until they have been brought to a common measure. This conversion step, often skipped, governs any correct reading of the spread. A companion piece: LNG as a Partial Connector: Linking TTF, Henry Hub and JKM.
Computing the spread: two units, one common measure
The conversion rests on a simple energy equivalence. One megawatt-hour represents about 3.4 million BTU. To compare a price in euros per megawatt-hour with a price in dollars per million BTU, one must therefore divide the former by that factor, then account for the euro-dollar exchange rate. The operation looks technical, but it is indispensable: without it, one compares incommensurable magnitudes.
The August 2022 episode provides the clearest illustration. TTF reached an intraday peak on the order of €342/MWh on 26 August 2022 (ICE Endex data), which corresponds, once converted, to nearly $100/MMBtu — the euro and dollar then close to parity. At the same moment, according to the US Energy Information Administration, Henry Hub peaked around $8.80/MMBtu. The spread thus reached, in energy terms, a factor of about ten to twelve. Only once the conversion is done does that figure take on meaning: it reflects neither a currency effect nor an illusion of units, but a real energy cost gap of a factor of ten between the two shores.
The same rigor applies to recent, far more moderate levels. In early 2026, the EIA’s weekly figures placed TTF around $12/MMBtu, against a Henry Hub on the order of $3 to $5/MMBtu — a spread brought down to a factor of about three. The gap has thus narrowed sharply from the peak, without returning to the era of cheap Russian gas, when it was near zero. Tracking the spread over time is reading that breathing: a factor of ten at the height of 2022, a factor of three in a milder strain, a marginal gap before 2021. Related discussion: Anatomy of the 2022 Gas Shock: From the Russian Cutoff to Rationing.
A methodological point is worth noting. Henry Hub averaged $2.21/MMBtu in 2024, the lowest real price ever recorded according to the EIA, against $6.45/MMBtu in 2022. The width of the spread therefore depends as much on movements in the American denominator as in the European numerator: a very low Henry Hub widens the gap even with TTF unchanged. Reading the spread without watching both components leads to attributing to the European price alone what sometimes owes to American abundance.
What the spread contains
Decomposing the gap shows it is not a homogeneous block but the sum of several components. The first is the cost of the liquefied natural gas chain. American gas shipped to Europe carries liquefaction, sea transport and regasification costs; as long as sending a cargo stays profitable, these costs set a floor below which the gap does not fall. The spread therefore structurally incorporates the price of the logistical bridge between the two markets.
The second component reflects the supply-demand balance on each shore. In the US, abundant domestic production sustains a low price; in Europe, import dependence exposes the price to any supply strain. The spread thus reflects, at every moment, the difference in situation between a well-supplied zone and an importing one. The third component is available physical capacity: number of carriers, regasification terminals, long-term contracts already committed. When that capacity is saturated, arbitrage can no longer narrow the gap, and the spread widens independently of price fundamentals.
A fourth component, often omitted, works to Europe’s disadvantage: the cost of carbon. The European Union’s emissions trading system raises the cost of using fossil fuels, adding to the full cost of European energy a charge absent, to date, from the American market. For a reading in competitiveness terms, the relevant differential is therefore not the gas spread alone, but the spread augmented by this regulatory gap. The price fracture is compounded by a carbon-pricing one.
No single component dominates at all times, which is what makes the spread informative rather than mechanical. In a cold winter with saturated terminals, capacity drives the gap; in a mild period with ample supply, the transport floor and the supply balance set it; through the year, the carbon wedge adds a steady increment on the European side. Reading the spread well means asking, at each moment, which component is doing the work — not treating the number as a fixed property of the two markets.
From the spread to competitiveness
The spread’s value goes beyond market description: it reads as a gauge of relative competitiveness. For an activity where energy weighs heavily in costs, a durable gap means a European plant carries an energy bill bearing no relation to its American competitor’s. The spread then becomes a measure, sector by sector, of the energy advantage or handicap of a location. It is this reading that justifies its tracking by industrial decision-makers, beyond trading desks, and that links it directly to the cost to European industry of the most exposed sectors.
This interpretation calls for an epistemic caution. The spread is an observable fact, computed from two public price series; the competitiveness differential inferred from it is, by contrast, an inference. It assumes energy represents a significant part of the cost structure — true for energy-intensive sectors, but false for most of the economy. Applying the spread as a competitiveness verdict to sectors where energy is marginal would overstate its effect. Rigor requires distinguishing the number, which is solid, from its reach, which depends on the sector in view. It is on this measurement base that the whole of the gas price fracture and its consequences rests, and more broadly the physical market analysis of energy.
Why it is not an oil spread
A common comparison can mislead: equating the gas spread with a gap between two oil benchmarks, like the one separating US crude from European crude. Both are gaps between regional prices, but their nature differs profoundly. In oil, the gap mainly reflects logistical frictions — shipping costs, refining constraints, export bottlenecks — within a market that is otherwise global and arbitraged. That gap tends to dissolve as soon as arbitrage becomes profitable again, because oil moves freely. On this point: the link between gas prices and the euro.
The gas spread does not dissolve the same way. It separates two markets that nothing compels to converge as long as transport capacity stays limited. Where the equivalent spread on oil measures a friction within a unified market, the gas spread measures a fracture between two structurally distinct markets. Confusing the two leads one to expect from gas a return to equilibrium that, for it, has no mechanical reason to occur. It is a difference in kind, not in degree.
The practical consequence follows directly. An oil-style reading treats a wide spread as a temporary dislocation and waits for reversion; a gas-appropriate reading treats it as a structural feature and plans around it. The first frames the gap as noise, the second as signal. For an industrial planner, mistaking one for the other is not a fine point of vocabulary but the difference between assuming a cost disadvantage will fade and accepting it may not.
It is often assumed the gas spread will eventually close, like a gap between two oil prices. That expectation is misleading: an oil spread dissolves through arbitrage because crude moves freely, whereas the gas spread separates two markets that the transport constraint keeps distinct. It narrows when linking capacity grows, but nothing returns it mechanically to zero.
The TTF–Henry Hub spread is thus the central instrument for reading the gas fracture: a single number, provided it is computed correctly and interpreted with measure. Properly converted, it states the real size of the cost gap; properly decomposed, it reveals its drivers; properly framed, it illuminates competitiveness without reducing it. It is less a market signal than a reading grid for the cost of the separation between two energy worlds.
Last updated — 12 July 2026
Disclaimer – Financial Information: The analyses, commentary, and content published on eco3min.fr are provided for informational and educational purposes only. They do not constitute investment advice or a solicitation to buy or sell financial instruments. Past performance is not indicative of future results. All investment decisions involve risk and are the sole responsibility of the reader.
Read next
Full pillar →Reading the refinery utilisation rate: the threshold, the season, the turnarounds
A refinery runs full near ninety percent, not a hundred: the last slice of nameplate capacity is a…
IMO 2020: the regulatory shock that rewrote product spreads
An environmental rule on marine sulfur can move a refining spread more than a swing in crude. IMO…
The 2022–2023 refining golden age: anatomy of an episode
In 2022, refined fuel prices climbed faster than crude. That gap, measured by the 3-2-1 crack spread, reached…


