
Every FOMC rate decision since 1990
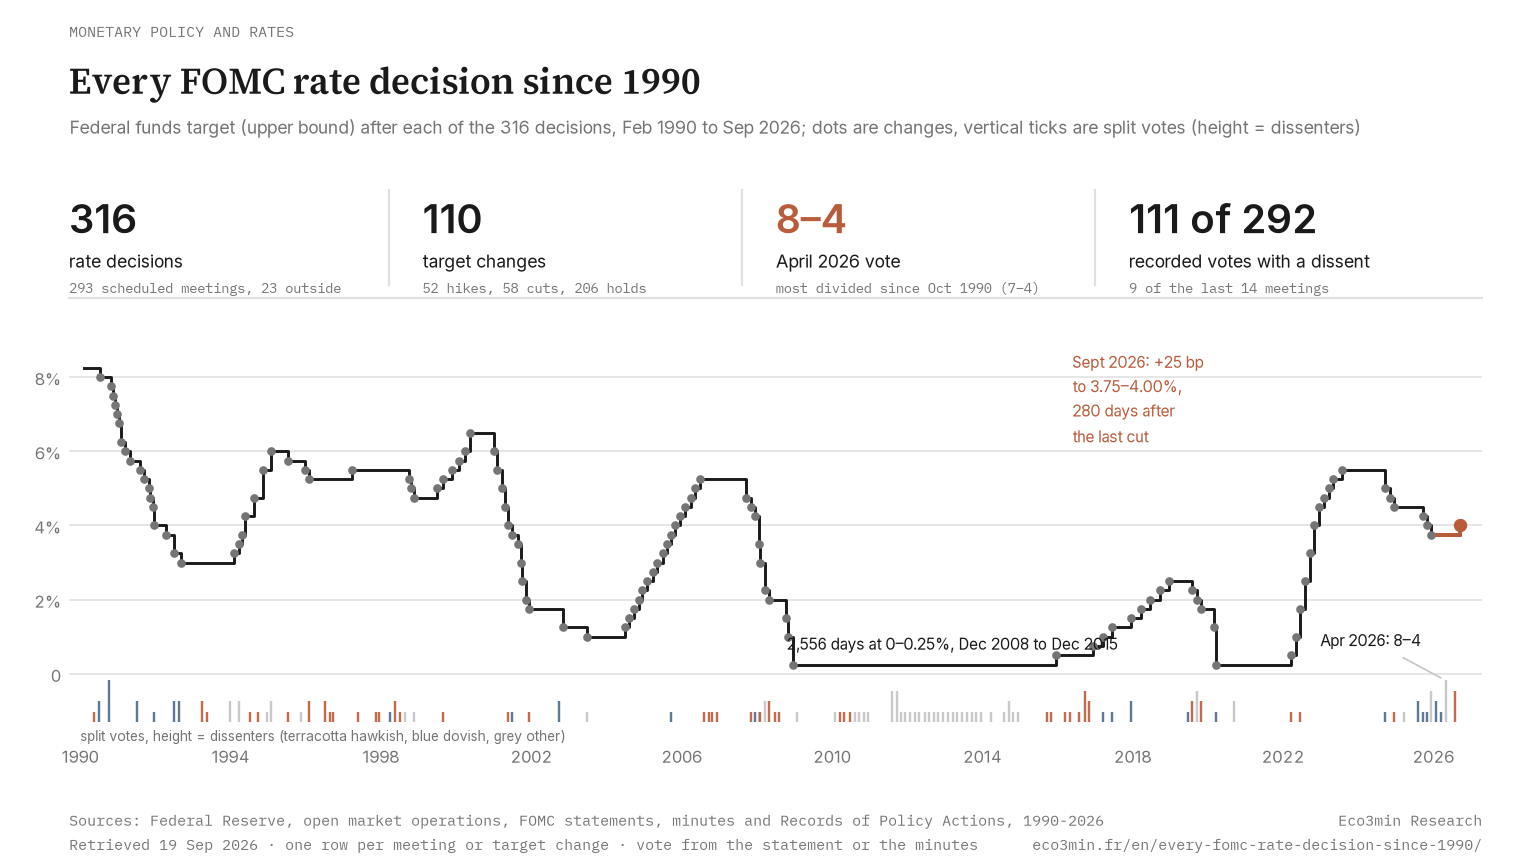
Since February 1990 the Federal Open Market Committee has taken 316 rate decisions: 293 scheduled meetings plus 23 changes made outside them. This register lists every one, with the vote, the dissenters and their side.
The FOMC moves at one meeting in three and disagrees at more than one in three. In 2025 and 2026 it has disagreed at nine meetings out of fourteen.
In April 2026 the FOMC split 8–4, its most divided vote since October 1990; nine of its last fourteen meetings have had a dissent.
- 316 decisions from February 1990 to September 2026: 110 changes of the target (52 hikes, 58 cuts) and 206 holds. 23 of the changes were made outside a scheduled meeting, and 18 of them were never announced, before the first statement of February 1994.
- 111 of the 292 recorded votes had at least one dissent. Under Ben Bernanke the share was 62%, under Alan Greenspan 24%, under Janet Yellen 47%, under Jerome Powell 27%. The longest run of split votes: 20 consecutive meetings, ending in December 2013.
- Fourteen cycles. The largest: 2022–23 hiking cycle, +525 basis points in 497 days; the longest hold: 2,556 days at 0–0.25% from December 2008 to December 2015. The September 2026 hike comes 280 days after the last cut, the second-shortest reversal in the register after 1999.
- The 10-year Treasury moves by 7.3 to 10.3 basis points on average, in absolute terms, from the day before a decision to the day after, a little more around a cut than around a hold.
What the register counts
One row per FOMC decision: every scheduled meeting, hold or not, from 7 February 1990 to 16 September 2026; every unscheduled meeting or conference call that changed the target; and every change implemented between two meetings, which is how the Committee worked before it began announcing its decisions in February 1994. The FOMC meeting calendar gives the next date and time; this register gives every previous decision and how it was voted.
Six figures summarise the series. Each is defined in the method section and recomputed from the CSV at the bottom of the page.
Peak and trough are measured the same way as in the ECB decision register: the number of days between the last move of a cycle and the first move of the next one in the opposite direction. The six completed hiking cycles held their peak for 155, 553, 232, 446, 224 and 420 days; the seven troughs held for 518, 419, 225, 371, 2,556, 731 and 280 days. The Fed, like the ECB, stays at the bottom far longer than at the top, but its peaks last longer: the 1997 peak held 553 days, the 2006 peak 446, the 2023 peak 420.
The 110 target changes, one row each
The table keeps the decisions that moved the target. Until 16 December 2008 the target is a single rate; since then it is a range, and the change is measured on its upper bound, the convention of the FRED series DFEDTARU. The vote is read from the statement, the minutes or the Record of Policy Actions; when the change was implemented by the Desk between two meetings, no vote is attached to it.
| Decision | Type | Meeting | Target before | Target after | Change | Vote | Dissent | 10y Treasury, D-1 to D+1 | |
|---|---|---|---|---|---|---|---|---|---|
| 13 Jul 1990 | cut | intermeeting | 8.25% | 8.00% | −25 bp | n.d. | −6 bp | ||
| 29 Oct 1990 | cut | intermeeting | 8.00% | 7.75% | −25 bp | n.d. | +7 bp | ||
| 13 Nov 1990 | cut | scheduled | 7.75% | 7.50% | −25 bp | 11–0 | −13 bp | ||
| 7 Dec 1990 | cut | unscheduled | 7.50% | 7.25% | −25 bp | n.d. | −20 bp | ||
| 18 Dec 1990 | cut | scheduled | 7.25% | 7.00% | −25 bp | 10–0 | −2 bp | ||
| 9 Jan 1991 | cut | unscheduled | 7.00% | 6.75% | −25 bp | n.d. | 0 | ||
| 1 Feb 1991 | cut | unscheduled | 6.75% | 6.25% | −50 bp | n.d. | −15 bp | ||
| 8 Mar 1991 | cut | intermeeting | 6.25% | 6.00% | −25 bp | n.d. | −1 bp | ||
| 30 Apr 1991 | cut | unscheduled | 6.00% | 5.75% | −25 bp | n.d. | −6 bp | ||
| 5 Aug 1991 | cut | unscheduled | 5.75% | 5.50% | −25 bp | n.d. | −9 bp | ||
| 13 Sep 1991 | cut | unscheduled | 5.50% | 5.25% | −25 bp | n.d. | −4 bp | ||
| 30 Oct 1991 | cut | unscheduled | 5.25% | 5.00% | −25 bp | n.d. | −4 bp | ||
| 5 Nov 1991 | cut | scheduled | 5.00% | 4.75% | −25 bp | 10–0 | +1 bp | ||
| 6 Dec 1991 | cut | intermeeting | 4.75% | 4.50% | −25 bp | n.d. | +1 bp | ||
| 20 Dec 1991 | cut | intermeeting | 4.50% | 4.00% | −50 bp | n.d. | −23 bp | ||
| 9 Apr 1992 | cut | intermeeting | 4.00% | 3.75% | −25 bp | n.d. | −7 bp | ||
| 1 Jul 1992 | cut | scheduled | 3.75% | 3.25% | −50 bp | 10–2 | dovish | −21 bp | |
| 4 Sep 1992 | cut | intermeeting | 3.25% | 3.00% | −25 bp | n.d. | −25 bp | ||
| 4 Feb 1994 | hike | scheduled | 3.00% | 3.25% | +25 bp | 9–0 | +15 bp | ||
| 22 Mar 1994 | hike | scheduled | 3.25% | 3.50% | +25 bp | 8–2 | other | −11 bp | |
| 18 Apr 1994 | hike | unscheduled | 3.50% | 3.75% | +25 bp | n.d. | +13 bp | ||
| 17 May 1994 | hike | scheduled | 3.75% | 4.25% | +50 bp | 10–0 | −21 bp | ||
| 16 Aug 1994 | hike | scheduled | 4.25% | 4.75% | +50 bp | 12–0 | −15 bp | ||
| 15 Nov 1994 | hike | scheduled | 4.75% | 5.50% | +75 bp | 12–0 | +3 bp | ||
| 1 Feb 1995 | hike | scheduled | 5.50% | 6.00% | +50 bp | 10–2 | other | +8 bp | |
| 6 Jul 1995 | cut | scheduled | 6.00% | 5.75% | −25 bp | 10–1 | hawkish | −15 bp | |
| 19 Dec 1995 | cut | scheduled | 5.75% | 5.50% | −25 bp | 11–0 | −9 bp | ||
| 31 Jan 1996 | cut | scheduled | 5.50% | 5.25% | −25 bp | 8–2 | hawkish | 0 | |
| 25 Mar 1997 | hike | scheduled | 5.25% | 5.50% | +25 bp | 10–0 | +8 bp | ||
| 29 Sep 1998 | cut | scheduled | 5.50% | 5.25% | −25 bp | 11–0 | −17 bp | ||
| 15 Oct 1998 | cut | unscheduled | 5.25% | 5.00% | −25 bp | n.d. | −14 bp | ||
| 17 Nov 1998 | cut | scheduled | 5.00% | 4.75% | −25 bp | 10–1 | other | 0 | |
| 30 Jun 1999 | hike | scheduled | 4.75% | 5.00% | +25 bp | 9–0 | −8 bp | ||
| 24 Aug 1999 | hike | scheduled | 5.00% | 5.25% | +25 bp | 9–1 | hawkish | −16 bp | |
| 16 Nov 1999 | hike | scheduled | 5.25% | 5.50% | +25 bp | n.d. | +10 bp | ||
| 2 Feb 2000 | hike | scheduled | 5.50% | 5.75% | +25 bp | 10–0 | −13 bp | ||
| 21 Mar 2000 | hike | scheduled | 5.75% | 6.00% | +25 bp | 10–0 | −5 bp | ||
| 16 May 2000 | hike | scheduled | 6.00% | 6.50% | +50 bp | 10–0 | +1 bp | ||
| 3 Jan 2001 | cut | unscheduled | 6.50% | 6.00% | −50 bp | n.d. | +11 bp | ||
| 31 Jan 2001 | cut | scheduled | 6.00% | 5.50% | −50 bp | 10–0 | −14 bp | ||
| 20 Mar 2001 | cut | scheduled | 5.50% | 5.00% | −50 bp | 10–0 | −5 bp | ||
| 18 Apr 2001 | cut | unscheduled | 5.00% | 4.50% | −50 bp | n.d. | +6 bp | ||
| 15 May 2001 | cut | scheduled | 4.50% | 4.00% | −50 bp | 9–1 | hawkish | +2 bp | |
| 27 Jun 2001 | cut | scheduled | 4.00% | 3.75% | −25 bp | 9–1 | dovish | +11 bp | |
| 21 Aug 2001 | cut | scheduled | 3.75% | 3.50% | −25 bp | 10–0 | 0 | ||
| 17 Sep 2001 | cut | unscheduled | 3.50% | 3.00% | −50 bp | n.d. | +15 bp | ||
| 2 Oct 2001 | cut | scheduled | 3.00% | 2.50% | −50 bp | 10–0 | −5 bp | ||
| 6 Nov 2001 | cut | scheduled | 2.50% | 2.00% | −50 bp | 10–0 | −9 bp | ||
| 11 Dec 2001 | cut | scheduled | 2.00% | 1.75% | −25 bp | 10–1 | hawkish | −15 bp | |
| 6 Nov 2002 | cut | scheduled | 1.75% | 1.25% | −50 bp | 12–0 | −22 bp | ||
| 25 Jun 2003 | cut | scheduled | 1.25% | 1.00% | −25 bp | 11–1 | other | +26 bp | |
| 30 Jun 2004 | hike | scheduled | 1.00% | 1.25% | +25 bp | 12–0 | −13 bp | ||
| 10 Aug 2004 | hike | scheduled | 1.25% | 1.50% | +25 bp | 12–0 | +2 bp | ||
| 21 Sep 2004 | hike | scheduled | 1.50% | 1.75% | +25 bp | 12–0 | −7 bp | ||
| 10 Nov 2004 | hike | scheduled | 1.75% | 2.00% | +25 bp | 12–0 | −2 bp | ||
| 14 Dec 2004 | hike | scheduled | 2.00% | 2.25% | +25 bp | 12–0 | −7 bp | ||
| 2 Feb 2005 | hike | scheduled | 2.25% | 2.50% | +25 bp | 12–0 | +3 bp | ||
| 22 Mar 2005 | hike | scheduled | 2.50% | 2.75% | +25 bp | 12–0 | +8 bp | ||
| 3 May 2005 | hike | scheduled | 2.75% | 3.00% | +25 bp | 11–0 | −1 bp | ||
| 30 Jun 2005 | hike | scheduled | 3.00% | 3.25% | +25 bp | 11–0 | +7 bp | ||
| 9 Aug 2005 | hike | scheduled | 3.25% | 3.50% | +25 bp | 10–0 | −2 bp | ||
| 20 Sep 2005 | hike | scheduled | 3.50% | 3.75% | +25 bp | 9–1 | dovish | −6 bp | |
| 1 Nov 2005 | hike | scheduled | 3.75% | 4.00% | +25 bp | 10–0 | +4 bp | ||
| 13 Dec 2005 | hike | scheduled | 4.00% | 4.25% | +25 bp | 10–0 | −11 bp | ||
| 31 Jan 2006 | hike | scheduled | 4.25% | 4.50% | +25 bp | 10–0 | +3 bp | ||
| 28 Mar 2006 | hike | scheduled | 4.50% | 4.75% | +25 bp | 11–0 | +11 bp | ||
| 10 May 2006 | hike | scheduled | 4.75% | 5.00% | +25 bp | 11–0 | +1 bp | ||
| 29 Jun 2006 | hike | scheduled | 5.00% | 5.25% | +25 bp | 10–0 | −10 bp | ||
| 18 Sep 2007 | cut | scheduled | 5.25% | 4.75% | −50 bp | 10–0 | +5 bp | ||
| 31 Oct 2007 | cut | scheduled | 4.75% | 4.50% | −25 bp | 9–1 | hawkish | −4 bp | |
| 11 Dec 2007 | cut | scheduled | 4.50% | 4.25% | −25 bp | 9–1 | dovish | −10 bp | |
| 21 Jan 2008 | cut | unscheduled | 4.25% | 3.50% | −75 bp | 8–1 | other | −14 bp | |
| 30 Jan 2008 | cut | scheduled | 3.50% | 3.00% | −50 bp | 9–1 | hawkish | −2 bp | |
| 18 Mar 2008 | cut | scheduled | 3.00% | 2.25% | −75 bp | 8–2 | other | +4 bp | |
| 30 Apr 2008 | cut | scheduled | 2.25% | 2.00% | −25 bp | 8–2 | hawkish | −7 bp | |
| 7 Oct 2008 | cut | unscheduled | 2.00% | 1.50% | −50 bp | 10–0 | +24 bp | ||
| 29 Oct 2008 | cut | scheduled | 1.50% | 1.00% | −50 bp | 10–0 | +11 bp | ||
| 16 Dec 2008 | cut | scheduled | 1.00% | 0.00–0.25% | −75 bp | 10–0 | −33 bp | ||
| 16 Dec 2015 | hike | scheduled | 0.00–0.25% | 0.25–0.50% | +25 bp | 10–0 | −4 bp | ||
| 14 Dec 2016 | hike | scheduled | 0.25–0.50% | 0.50–0.75% | +25 bp | 10–0 | +12 bp | ||
| 15 Mar 2017 | hike | scheduled | 0.50–0.75% | 0.75–1.00% | +25 bp | 9–1 | dovish | −7 bp | |
| 14 Jun 2017 | hike | scheduled | 0.75–1.00% | 1.00–1.25% | +25 bp | 8–1 | dovish | −5 bp | |
| 13 Dec 2017 | hike | scheduled | 1.00–1.25% | 1.25–1.50% | +25 bp | 7–2 | dovish | −5 bp | |
| 21 Mar 2018 | hike | scheduled | 1.25–1.50% | 1.50–1.75% | +25 bp | 8–0 | −6 bp | ||
| 13 Jun 2018 | hike | scheduled | 1.50–1.75% | 1.75–2.00% | +25 bp | 8–0 | −2 bp | ||
| 26 Sep 2018 | hike | scheduled | 1.75–2.00% | 2.00–2.25% | +25 bp | 9–0 | −4 bp | ||
| 19 Dec 2018 | hike | scheduled | 2.00–2.25% | 2.25–2.50% | +25 bp | 10–0 | −3 bp | ||
| 31 Jul 2019 | cut | scheduled | 2.25–2.50% | 2.00–2.25% | −25 bp | 8–2 | hawkish | −16 bp | |
| 18 Sep 2019 | cut | scheduled | 2.00–2.25% | 1.75–2.00% | −25 bp | 7–3 | mixed | −2 bp | |
| 30 Oct 2019 | cut | scheduled | 1.75–2.00% | 1.50–1.75% | −25 bp | 8–2 | hawkish | −15 bp | |
| 2 Mar 2020 | cut | unscheduled | 1.50–1.75% | 1.00–1.25% | −50 bp | 10–0 | −11 bp | ||
| 15 Mar 2020 | cut | unscheduled | 1.00–1.25% | 0.00–0.25% | −100 bp | 9–1 | dovish | −21 bp | |
| 16 Mar 2022 | hike | scheduled | 0.00–0.25% | 0.25–0.50% | +25 bp | 8–1 | hawkish | +5 bp | |
| 4 May 2022 | hike | scheduled | 0.25–0.50% | 0.75–1.00% | +50 bp | 9–0 | +8 bp | ||
| 15 Jun 2022 | hike | scheduled | 0.75–1.00% | 1.50–1.75% | +75 bp | 10–1 | hawkish | −21 bp | |
| 27 Jul 2022 | hike | scheduled | 1.50–1.75% | 2.25–2.50% | +75 bp | 12–0 | −13 bp | ||
| 21 Sep 2022 | hike | scheduled | 2.25–2.50% | 3.00–3.25% | +75 bp | 12–0 | +13 bp | ||
| 2 Nov 2022 | hike | scheduled | 3.00–3.25% | 3.75–4.00% | +75 bp | 12–0 | +7 bp | ||
| 14 Dec 2022 | hike | scheduled | 3.75–4.00% | 4.25–4.50% | +50 bp | 12–0 | −7 bp | ||
| 1 Feb 2023 | hike | scheduled | 4.25–4.50% | 4.50–4.75% | +25 bp | 12–0 | −12 bp | ||
| 22 Mar 2023 | hike | scheduled | 4.50–4.75% | 4.75–5.00% | +25 bp | 11–0 | −21 bp | ||
| 3 May 2023 | hike | scheduled | 4.75–5.00% | 5.00–5.25% | +25 bp | 11–0 | −7 bp | ||
| 26 Jul 2023 | hike | scheduled | 5.00–5.25% | 5.25–5.50% | +25 bp | 11–0 | +10 bp | ||
| 18 Sep 2024 | cut | scheduled | 5.25–5.50% | 4.75–5.00% | −50 bp | 11–1 | dovish | +8 bp | |
| 7 Nov 2024 | cut | scheduled | 4.75–5.00% | 4.50–4.75% | −25 bp | 12–0 | −12 bp | ||
| 18 Dec 2024 | cut | scheduled | 4.50–4.75% | 4.25–4.50% | −25 bp | 11–1 | hawkish | +17 bp | |
| 17 Sep 2025 | cut | scheduled | 4.25–4.50% | 4.00–4.25% | −25 bp | 11–1 | dovish | +7 bp | |
| 29 Oct 2025 | cut | scheduled | 4.00–4.25% | 3.75–4.00% | −25 bp | 10–1 | dovish | +12 bp | |
| 10 Dec 2025 | cut | scheduled | 3.75–4.00% | 3.50–3.75% | −25 bp | 9–3 | mixed | −4 bp | |
| 16 Sep 2026 | hike | scheduled | 3.50–3.75% | 3.75–4.00% | +25 bp | 12–0 | n.d. |
Three readings. The 25 basis point step is the norm, 77 moves out of 110; the 24 steps of 50 and the 8 of 75 cluster in 1991–95, 2000–02, 2007–08, 2020, 2022 and September 2024; the single 100 point move is the 15 March 2020 cut, decided on a Sunday. Second, 23 of the 110 changes were decided outside a scheduled meeting, and 18 of those before the Committee announced anything: from 1990 to January 1994 the register dates them by the day the Desk implemented them. Third, the 10-year Treasury moves 10.3 basis points on average, in absolute terms, around a cut, 8.2 around a hike, 7.3 around a hold: the decision itself is usually in the price the day before, the surprise is in the words.
All 316 decisions, holds included
Columns: date, type of decision, outcome, target after, change, vote for–against, dissenters, chair, macro regime of the month by the eco3min classifier (* = degraded data quality before 2003), 10-year Treasury from the day before to the day after. The September 2026 hike is in terracotta.
| Decision | Type | Outcome | Target after | Change | Vote | Dissenters | Chair | Regime (eco3min) | 10y, D-1 to D+1 |
|---|---|---|---|---|---|---|---|---|---|
| 7 Feb 1990 | scheduled | hold | 8.25% | 11–0 | Greenspan | Inflationary Pressure* | −8 bp | ||
| 27 Mar 1990 | scheduled | hold | 8.25% | 11–0 | Greenspan | Inflationary Pressure* | 0 | ||
| 15 May 1990 | scheduled | hold | 8.25% | 10–1 | Mr. Hoskins Mr. Hoskins | Greenspan | Inflationary Pressure* | +7 bp | |
| 3 Jul 1990 | scheduled | hold | 8.25% | 9–2 | Ms. Seger and Mr. LaWare Absent and not voting: Mr. Johnson. Mr. LaWare | Greenspan | Inflationary Pressure* | −1 bp | |
| 13 Jul 1990 | intermeeting | cut | 8.00% | −25 bp | n.d. | Greenspan | Inflationary Pressure* | −6 bp | |
| 21 Aug 1990 | scheduled | hold | 8.00% | 11–0 | Greenspan | Inflationary Pressure* | +10 bp | ||
| 2 Oct 1990 | scheduled | hold | 8.00% | 7–4 | Messrs. Angell, Boykin, Hoskins, and Ms. Seger Ms. Seger | Greenspan | Stagflation* | 0 | |
| 29 Oct 1990 | intermeeting | cut | 7.75% | −25 bp | n.d. | Greenspan | Stagflation* | +7 bp | |
| 13 Nov 1990 | scheduled | cut | 7.50% | −25 bp | 11–0 | Greenspan | Stagflation* | −13 bp | |
| 7 Dec 1990 | unscheduled | cut | 7.25% | −25 bp | n.d. | Greenspan | Stagflation* | −20 bp | |
| 18 Dec 1990 | scheduled | cut | 7.00% | −25 bp | 10–0 | Greenspan | Stagflation* | −2 bp | |
| 9 Jan 1991 | unscheduled | cut | 6.75% | −25 bp | n.d. | Greenspan | Stagflation* | 0 | |
| 1 Feb 1991 | unscheduled | cut | 6.25% | −50 bp | n.d. | Greenspan | Stagflation* | −15 bp | |
| 6 Feb 1991 | scheduled | hold | 6.25% | 11–0 | Greenspan | Stagflation* | −3 bp | ||
| 8 Mar 1991 | intermeeting | cut | 6.00% | −25 bp | n.d. | Greenspan | Stagflation* | −1 bp | |
| 26 Mar 1991 | scheduled | hold | 6.00% | 10–0 | Greenspan | Stagflation* | −5 bp | ||
| 30 Apr 1991 | unscheduled | cut | 5.75% | −25 bp | n.d. | Greenspan | Stagflation* | −6 bp | |
| 14 May 1991 | scheduled | hold | 5.75% | 10–0 | Greenspan | Stagflation* | +6 bp | ||
| 3 Jul 1991 | scheduled | hold | 5.75% | 8–2 | Messrs. Angell and Black Messrs. Angell and Black | Greenspan | Inflationary Pressure* | +7 bp | |
| 5 Aug 1991 | unscheduled | cut | 5.50% | −25 bp | n.d. | Greenspan | Inflationary Pressure* | −9 bp | |
| 20 Aug 1991 | scheduled | hold | 5.50% | 10–0 | Greenspan | Inflationary Pressure* | −3 bp | ||
| 13 Sep 1991 | unscheduled | cut | 5.25% | −25 bp | n.d. | Greenspan | Inflationary Pressure* | −4 bp | |
| 1 Oct 1991 | scheduled | hold | 5.25% | 10–0 | Greenspan | Inflationary Pressure* | 0 | ||
| 30 Oct 1991 | unscheduled | cut | 5.00% | −25 bp | n.d. | Greenspan | Inflationary Pressure* | −4 bp | |
| 5 Nov 1991 | scheduled | cut | 4.75% | −25 bp | 10–0 | Greenspan | Inflationary Pressure* | +1 bp | |
| 6 Dec 1991 | intermeeting | cut | 4.50% | −25 bp | n.d. | Greenspan | Inflationary Pressure* | +1 bp | |
| 17 Dec 1991 | scheduled | hold | 4.50% | 11–1 | Mr. LaWare Mr. LaWare | Greenspan | Inflationary Pressure* | −2 bp | |
| 20 Dec 1991 | intermeeting | cut | 4.00% | −50 bp | n.d. | Greenspan | Inflationary Pressure* | −23 bp | |
| 5 Feb 1992 | scheduled | hold | 4.00% | 12–0 | Greenspan | Inflationary Pressure* | −9 bp | ||
| 31 Mar 1992 | scheduled | hold | 4.00% | 12–0 | Greenspan | Inflationary Pressure* | −8 bp | ||
| 9 Apr 1992 | intermeeting | cut | 3.75% | −25 bp | n.d. | Greenspan | Overheating* | −7 bp | |
| 19 May 1992 | scheduled | hold | 3.75% | 12–0 | Greenspan | Overheating* | −3 bp | ||
| 1 Jul 1992 | scheduled | cut | 3.25% | −50 bp | 10–2 | Mr. Jordan and Ms. Phillips Mr. Jordan and Ms. Phillips | Greenspan | Overheating* | −21 bp |
| 18 Aug 1992 | scheduled | hold | 3.25% | 10–2 | Messrs. LaWare and Melzer Messrs. LaWare and Melzer | Greenspan | Overheating* | −9 bp | |
| 4 Sep 1992 | intermeeting | cut | 3.00% | −25 bp | n.d. | Greenspan | Transition / Mixed signals* | −25 bp | |
| 6 Oct 1992 | scheduled | hold | 3.00% | n.d. | Greenspan | Transition / Mixed signals* | +22 bp | ||
| 17 Nov 1992 | scheduled | hold | 3.00% | 12–0 | Greenspan | Transition / Mixed signals* | −12 bp | ||
| 22 Dec 1992 | scheduled | hold | 3.00% | 12–0 | Greenspan | Balanced Expansion* | −3 bp | ||
| 3 Feb 1993 | scheduled | hold | 3.00% | n.d. | Greenspan | Balanced Expansion* | −7 bp | ||
| 23 Mar 1993 | scheduled | hold | 3.00% | 10–2 | Messrs. Angell and Lindsey Messrs. Angell and Lindsey | Greenspan | Balanced Expansion* | −1 bp | |
| 18 May 1993 | scheduled | hold | 3.00% | 10–1 | Messrs. Angell and Boehne Mr. Angell | Greenspan | Transition / Mixed signals* | +4 bp | |
| 7 Jul 1993 | scheduled | hold | 3.00% | 12–0 | Greenspan | Transition / Mixed signals* | −2 bp | ||
| 17 Aug 1993 | scheduled | hold | 3.00% | 12–0 | Greenspan | Transition / Mixed signals* | +1 bp | ||
| 21 Sep 1993 | scheduled | hold | 3.00% | n.d. | Greenspan | Transition / Mixed signals* | +3 bp | ||
| 16 Nov 1993 | scheduled | hold | 3.00% | n.d. | Greenspan | Balanced Expansion* | −4 bp | ||
| 21 Dec 1993 | scheduled | hold | 3.00% | 10–2 | Messrs. Angell and Lindsey Messrs. Angell and Lindsey | Greenspan | Balanced Expansion* | −9 bp | |
| 4 Feb 1994 | scheduled | hike | 3.25% | +25 bp | 9–0 | Greenspan | Balanced Expansion* | +15 bp | |
| 22 Mar 1994 | scheduled | hike | 3.50% | +25 bp | 8–2 | Messrs. Broaddus, and Jordan Messrs. Broaddus and Jordan | Greenspan | Balanced Expansion* | −11 bp |
| 18 Apr 1994 | unscheduled | hike | 3.75% | +25 bp | n.d. | Greenspan | Balanced Expansion* | +13 bp | |
| 17 May 1994 | scheduled | hike | 4.25% | +50 bp | 10–0 | Greenspan | Balanced Expansion* | −21 bp | |
| 6 Jul 1994 | scheduled | hold | 4.25% | 10–1 | Mr. Broaddus Mr. Broaddus | Greenspan | Balanced Expansion* | −1 bp | |
| 16 Aug 1994 | scheduled | hike | 4.75% | +50 bp | 12–0 | Greenspan | Balanced Expansion* | −15 bp | |
| 27 Sep 1994 | scheduled | hold | 4.75% | 11–1 | Mr. Broaddus Mr. Broaddus | Greenspan | Balanced Expansion* | 0 | |
| 15 Nov 1994 | scheduled | hike | 5.50% | +75 bp | 12–0 | Greenspan | Balanced Expansion* | +3 bp | |
| 20 Dec 1994 | scheduled | hold | 5.50% | 9–1 | Mr. Broaddus Absent and not voting : Mr. Forrestal and Ms. Phillips. Mr. Melzer voted as a | Greenspan | Balanced Expansion* | −1 bp | |
| 1 Feb 1995 | scheduled | hike | 6.00% | +50 bp | 10–2 | Messrs. Lindsey and Melzer The Committee also approved at this meeting an increase from $5 | Greenspan | Balanced Expansion* | +8 bp |
| 28 Mar 1995 | scheduled | hold | 6.00% | 11–0 | Greenspan | Balanced Expansion* | +11 bp | ||
| 23 May 1995 | scheduled | hold | 6.00% | 11–0 | Greenspan | Transition / Mixed signals* | −19 bp | ||
| 6 Jul 1995 | scheduled | cut | 5.75% | −25 bp | 10–1 | Mr. Hoenig Mr. Hoenig | Greenspan | Transition / Mixed signals* | −15 bp |
| 22 Aug 1995 | scheduled | hold | 5.75% | 11–0 | Greenspan | Transition / Mixed signals* | +6 bp | ||
| 26 Sep 1995 | scheduled | hold | 5.75% | 10–0 | Greenspan | Transition / Mixed signals* | +4 bp | ||
| 15 Nov 1995 | scheduled | hold | 5.75% | 9–1 | Mr. Lindsey Mr. Lindsey | Greenspan | Transition / Mixed signals* | −4 bp | |
| 19 Dec 1995 | scheduled | cut | 5.50% | −25 bp | 11–0 | Greenspan | Transition / Mixed signals* | −9 bp | |
| 31 Jan 1996 | scheduled | cut | 5.25% | −25 bp | 8–2 | Mr. Lindsey and Ms. Yellen Mr. Lindsey and Ms. Yellen | Greenspan | Transition / Mixed signals* | 0 |
| 26 Mar 1996 | scheduled | hold | 5.25% | 10–0 | Greenspan | Transition / Mixed signals* | +8 bp | ||
| 21 May 1996 | scheduled | hold | 5.25% | 10–0 | Greenspan | Balanced Expansion* | +1 bp | ||
| 3 Jul 1996 | scheduled | hold | 5.25% | 10–2 | Mr. Lindsey and Ms. Yellen Mr. Lindsey and Ms. Yellen | Greenspan | Balanced Expansion* | +26 bp | |
| 20 Aug 1996 | scheduled | hold | 5.25% | 11–1 | Mr. Stern Mr. Stern | Greenspan | Balanced Expansion* | +2 bp | |
| 24 Sep 1996 | scheduled | hold | 5.25% | 11–1 | Mr. Stern Mr. Stern | Greenspan | Balanced Expansion* | −12 bp | |
| 13 Nov 1996 | scheduled | hold | 5.25% | 12–0 | Greenspan | Balanced Expansion* | −4 bp | ||
| 17 Dec 1996 | scheduled | hold | 5.25% | 12–0 | Greenspan | Balanced Expansion* | +7 bp | ||
| 5 Feb 1997 | scheduled | hold | 5.25% | 10–0 | Greenspan | Balanced Expansion* | +4 bp | ||
| 25 Mar 1997 | scheduled | hike | 5.50% | +25 bp | 10–0 | Greenspan | Balanced Expansion* | +8 bp | |
| 20 May 1997 | scheduled | hold | 5.50% | 9–1 | Mr. Broaddus Mr. Broaddus | Greenspan | Balanced Expansion* | +3 bp | |
| 2 Jul 1997 | scheduled | hold | 5.50% | 10–0 | Greenspan | Balanced Expansion* | −14 bp | ||
| 19 Aug 1997 | scheduled | hold | 5.50% | 10–0 | Greenspan | Balanced Expansion* | +3 bp | ||
| 30 Sep 1997 | scheduled | hold | 5.50% | 10–0 | Greenspan | Balanced Expansion* | −6 bp | ||
| 12 Nov 1997 | scheduled | hold | 5.50% | 11–1 | Mr. Broaddus Mr. Broaddus | Greenspan | Balanced Expansion* | −4 bp | |
| 16 Dec 1997 | scheduled | hold | 5.50% | 11–1 | Mr. Broaddus Mr. Broaddus | Greenspan | Balanced Expansion* | +3 bp | |
| 4 Feb 1998 | scheduled | hold | 5.50% | 12–0 | Greenspan | Balanced Expansion* | +6 bp | ||
| 31 Mar 1998 | scheduled | hold | 5.50% | 11–1 | Mr. Jordan Mr. Jordan | Greenspan | Balanced Expansion* | −10 bp | |
| 19 May 1998 | scheduled | hold | 5.50% | 10–2 | Messrs. Jordan and Poole Mr. Poole | Greenspan | Balanced Expansion* | −3 bp | |
| 1 Jul 1998 | scheduled | hold | 5.50% | 10–1 | Mr. Jordan Mr. Jordan | Greenspan | Transition / Mixed signals* | −2 bp | |
| 18 Aug 1998 | scheduled | hold | 5.50% | 10–1 | Mr. Jordan Mr. Jordan | Greenspan | Transition / Mixed signals* | +2 bp | |
| 29 Sep 1998 | scheduled | cut | 5.25% | −25 bp | 11–0 | Greenspan | Transition / Mixed signals* | −17 bp | |
| 15 Oct 1998 | unscheduled | cut | 5.00% | −25 bp | n.d. | Greenspan | Balanced Expansion* | −14 bp | |
| 17 Nov 1998 | scheduled | cut | 4.75% | −25 bp | 10–1 | Mr. Jordan Mr. Jordan | Greenspan | Balanced Expansion* | 0 |
| 22 Dec 1998 | scheduled | hold | 4.75% | 11–0 | Greenspan | Balanced Expansion* | +17 bp | ||
| 3 Feb 1999 | scheduled | hold | 4.75% | 11–0 | Greenspan | Balanced Expansion* | +10 bp | ||
| 30 Mar 1999 | scheduled | hold | 4.75% | 11–0 | Greenspan | Balanced Expansion* | −3 bp | ||
| 18 May 1999 | scheduled | hold | 4.75% | 11–0 | Greenspan | Balanced Expansion* | −6 bp | ||
| 30 Jun 1999 | scheduled | hike | 5.00% | +25 bp | 9–0 | Greenspan | Balanced Expansion* | −8 bp | |
| 24 Aug 1999 | scheduled | hike | 5.25% | +25 bp | 9–1 | Mr. McTeer Mr. McTeer | Greenspan | Balanced Expansion* | −16 bp |
| 5 Oct 1999 | scheduled | hold | 5.25% | 10–0 | Greenspan | Balanced Expansion* | +9 bp | ||
| 16 Nov 1999 | scheduled | hike | 5.50% | +25 bp | n.d. | Greenspan | Balanced Expansion* | +10 bp | |
| 21 Dec 1999 | scheduled | hold | 5.50% | 10–0 | Greenspan | Balanced Expansion* | +3 bp | ||
| 2 Feb 2000 | scheduled | hike | 5.75% | +25 bp | 10–0 | Greenspan | Balanced Expansion* | −13 bp | |
| 21 Mar 2000 | scheduled | hike | 6.00% | +25 bp | 10–0 | Greenspan | Balanced Expansion* | −5 bp | |
| 16 May 2000 | scheduled | hike | 6.50% | +50 bp | 10–0 | Greenspan | Balanced Expansion* | +1 bp | |
| 28 Jun 2000 | scheduled | hold | 6.50% | 10–0 | Greenspan | Balanced Expansion* | −6 bp | ||
| 22 Aug 2000 | scheduled | hold | 6.50% | 10–0 | Greenspan | Transition / Mixed signals* | −6 bp | ||
| 3 Oct 2000 | scheduled | hold | 6.50% | 10–0 | Greenspan | Transition / Mixed signals* | +7 bp | ||
| 15 Nov 2000 | scheduled | hold | 6.50% | 10–0 | Greenspan | Transition / Mixed signals* | −8 bp | ||
| 19 Dec 2000 | scheduled | hold | 6.50% | 10–0 | Greenspan | Transition / Mixed signals* | −9 bp | ||
| 3 Jan 2001 | unscheduled | cut | 6.00% | −50 bp | n.d. | Greenspan | Transition / Mixed signals* | +11 bp | |
| 31 Jan 2001 | scheduled | cut | 5.50% | −50 bp | 10–0 | Greenspan | Transition / Mixed signals* | −14 bp | |
| 20 Mar 2001 | scheduled | cut | 5.00% | −50 bp | 10–0 | Greenspan | Slowdown* | −5 bp | |
| 18 Apr 2001 | unscheduled | cut | 4.50% | −50 bp | n.d. | Greenspan | Slowdown* | +6 bp | |
| 15 May 2001 | scheduled | cut | 4.00% | −50 bp | 9–1 | Mr. Hoenig Mr. Hoenig | Greenspan | Slowdown* | +2 bp |
| 27 Jun 2001 | scheduled | cut | 3.75% | −25 bp | 9–1 | Mr. Poole Mr. Poole | Greenspan | Slowdown* | +11 bp |
| 21 Aug 2001 | scheduled | cut | 3.50% | −25 bp | 10–0 | Greenspan | Slowdown* | 0 | |
| 17 Sep 2001 | unscheduled | cut | 3.00% | −50 bp | n.d. | Greenspan | Slowdown* | +15 bp | |
| 2 Oct 2001 | scheduled | cut | 2.50% | −50 bp | 10–0 | Greenspan | Slowdown* | −5 bp | |
| 6 Nov 2001 | scheduled | cut | 2.00% | −50 bp | 10–0 | Greenspan | Slowdown* | −9 bp | |
| 11 Dec 2001 | scheduled | cut | 1.75% | −25 bp | 10–1 | Mr. Hoenig Absent and not voting: Mr. Kelley. Mr. Hoenig | Greenspan | Slowdown* | −15 bp |
| 30 Jan 2002 | scheduled | hold | 1.75% | 10–0 | Greenspan | Transition / Mixed signals* | +5 bp | ||
| 19 Mar 2002 | scheduled | hold | 1.75% | 10–0 | Greenspan | Transition / Mixed signals* | +8 bp | ||
| 7 May 2002 | scheduled | hold | 1.75% | 10–0 | Greenspan | Transition / Mixed signals* | +14 bp | ||
| 26 Jun 2002 | scheduled | hold | 1.75% | 10–0 | Greenspan | Transition / Mixed signals* | −4 bp | ||
| 13 Aug 2002 | scheduled | hold | 1.75% | 12–0 | Greenspan | Transition / Mixed signals* | −16 bp | ||
| 24 Sep 2002 | scheduled | hold | 1.75% | 10–2 | Edward M. Gramlich and Robert D. McTeer, Jr. Governor Gramlich and President McTeer prefer | Greenspan | Transition / Mixed signals* | +7 bp | |
| 6 Nov 2002 | scheduled | cut | 1.25% | −50 bp | 12–0 | Greenspan | Transition / Mixed signals* | −22 bp | |
| 10 Dec 2002 | scheduled | hold | 1.25% | 12–0 | Greenspan | Transition / Mixed signals* | −5 bp | ||
| 29 Jan 2003 | scheduled | hold | 1.25% | 12–0 | Greenspan | Transition / Mixed signals | 0 | ||
| 18 Mar 2003 | scheduled | hold | 1.25% | 12–0 | Greenspan | Transition / Mixed signals | +16 bp | ||
| 6 May 2003 | scheduled | hold | 1.25% | 12–0 | Greenspan | Transition / Mixed signals | −20 bp | ||
| 25 Jun 2003 | scheduled | cut | 1.00% | −25 bp | 11–1 | Robert T. Parry | Greenspan | Transition / Mixed signals | +26 bp |
| 12 Aug 2003 | scheduled | hold | 1.00% | 12–0 | Greenspan | Transition / Mixed signals | +20 bp | ||
| 16 Sep 2003 | scheduled | hold | 1.00% | 12–0 | Greenspan | Transition / Mixed signals | −8 bp | ||
| 28 Oct 2003 | scheduled | hold | 1.00% | 12–0 | Greenspan | Transition / Mixed signals | +1 bp | ||
| 9 Dec 2003 | scheduled | hold | 1.00% | 12–0 | Greenspan | Balanced Expansion | +1 bp | ||
| 28 Jan 2004 | scheduled | hold | 1.00% | 12–0 | Greenspan | Balanced Expansion | +11 bp | ||
| 16 Mar 2004 | scheduled | hold | 1.00% | 12–0 | Greenspan | Balanced Expansion | −7 bp | ||
| 4 May 2004 | scheduled | hold | 1.00% | 12–0 | Greenspan | Balanced Expansion | +8 bp | ||
| 30 Jun 2004 | scheduled | hike | 1.25% | +25 bp | 12–0 | Greenspan | Balanced Expansion | −13 bp | |
| 10 Aug 2004 | scheduled | hike | 1.50% | +25 bp | 12–0 | Greenspan | Balanced Expansion | +2 bp | |
| 21 Sep 2004 | scheduled | hike | 1.75% | +25 bp | 12–0 | Greenspan | Balanced Expansion | −7 bp | |
| 10 Nov 2004 | scheduled | hike | 2.00% | +25 bp | 12–0 | Greenspan | Balanced Expansion | −2 bp | |
| 14 Dec 2004 | scheduled | hike | 2.25% | +25 bp | 12–0 | Greenspan | Balanced Expansion | −7 bp | |
| 2 Feb 2005 | scheduled | hike | 2.50% | +25 bp | 12–0 | Greenspan | Balanced Expansion | +3 bp | |
| 22 Mar 2005 | scheduled | hike | 2.75% | +25 bp | 12–0 | Greenspan | Balanced Expansion | +8 bp | |
| 3 May 2005 | scheduled | hike | 3.00% | +25 bp | 11–0 | Greenspan | Balanced Expansion | −1 bp | |
| 30 Jun 2005 | scheduled | hike | 3.25% | +25 bp | 11–0 | Greenspan | Balanced Expansion | +7 bp | |
| 9 Aug 2005 | scheduled | hike | 3.50% | +25 bp | 10–0 | Greenspan | Balanced Expansion | −2 bp | |
| 20 Sep 2005 | scheduled | hike | 3.75% | +25 bp | 9–1 | Mark W. Olson | Greenspan | Balanced Expansion | −6 bp |
| 1 Nov 2005 | scheduled | hike | 4.00% | +25 bp | 10–0 | Greenspan | Transition / Mixed signals | +4 bp | |
| 13 Dec 2005 | scheduled | hike | 4.25% | +25 bp | 10–0 | Greenspan | Balanced Expansion | −11 bp | |
| 31 Jan 2006 | scheduled | hike | 4.50% | +25 bp | 10–0 | Greenspan | Balanced Expansion | +3 bp | |
| 28 Mar 2006 | scheduled | hike | 4.75% | +25 bp | 11–0 | Bernanke | Balanced Expansion | +11 bp | |
| 10 May 2006 | scheduled | hike | 5.00% | +25 bp | 11–0 | Bernanke | Transition / Mixed signals | +1 bp | |
| 29 Jun 2006 | scheduled | hike | 5.25% | +25 bp | 10–0 | Bernanke | Transition / Mixed signals | −10 bp | |
| 8 Aug 2006 | scheduled | hold | 5.25% | 9–1 | Jeffrey M. Lacker | Bernanke | Inflationary Pressure | −1 bp | |
| 20 Sep 2006 | scheduled | hold | 5.25% | 10–1 | Jeffrey M. Lacker | Bernanke | Inflationary Pressure | −9 bp | |
| 25 Oct 2006 | scheduled | hold | 5.25% | 10–1 | Jeffrey M. Lacker | Bernanke | Inflationary Pressure | −10 bp | |
| 12 Dec 2006 | scheduled | hold | 5.25% | 10–1 | Jeffrey M. Lacker | Bernanke | Transition / Mixed signals | +6 bp | |
| 31 Jan 2007 | scheduled | hold | 5.25% | 11–0 | Bernanke | Transition / Mixed signals | −4 bp | ||
| 21 Mar 2007 | scheduled | hold | 5.25% | 10–0 | Bernanke | Inflationary Pressure | +4 bp | ||
| 9 May 2007 | scheduled | hold | 5.25% | 10–0 | Bernanke | Transition / Mixed signals | +2 bp | ||
| 28 Jun 2007 | scheduled | hold | 5.25% | 10–0 | Bernanke | Transition / Mixed signals | −6 bp | ||
| 7 Aug 2007 | scheduled | hold | 5.25% | 10–0 | Bernanke | Transition / Mixed signals | +12 bp | ||
| 18 Sep 2007 | scheduled | cut | 4.75% | −50 bp | 10–0 | Bernanke | Transition / Mixed signals | +5 bp | |
| 31 Oct 2007 | scheduled | cut | 4.50% | −25 bp | 9–1 | Thomas M. Hoenig | Bernanke | Transition / Mixed signals | −4 bp |
| 11 Dec 2007 | scheduled | cut | 4.25% | −25 bp | 9–1 | Eric S. Rosengren | Bernanke | Transition / Mixed signals | −10 bp |
| 21 Jan 2008 | unscheduled | cut | 3.50% | −75 bp | 8–1 | William Poole | Bernanke | Transition / Mixed signals | −14 bp |
| 30 Jan 2008 | scheduled | cut | 3.00% | −50 bp | 9–1 | Richard W. Fisher | Bernanke | Transition / Mixed signals | −2 bp |
| 18 Mar 2008 | scheduled | cut | 2.25% | −75 bp | 8–2 | Richard W. Fisher and Charles I. Plosser | Bernanke | Transition / Mixed signals | +4 bp |
| 30 Apr 2008 | scheduled | cut | 2.00% | −25 bp | 8–2 | Richard W. Fisher and Charles I. Plosser | Bernanke | Slowdown | −7 bp |
| 25 Jun 2008 | scheduled | hold | 2.00% | 9–1 | Richard W. Fisher | Bernanke | Slowdown | −3 bp | |
| 5 Aug 2008 | scheduled | hold | 2.00% | 10–1 | Richard W. Fisher | Bernanke | Slowdown | +8 bp | |
| 16 Sep 2008 | scheduled | hold | 2.00% | 10–0 | Bernanke | Slowdown | −6 bp | ||
| 7 Oct 2008 | unscheduled | cut | 1.50% | −50 bp | 10–0 | Bernanke | Slowdown | +24 bp | |
| 29 Oct 2008 | scheduled | cut | 1.00% | −50 bp | 10–0 | Bernanke | Slowdown | +11 bp | |
| 16 Dec 2008 | scheduled | cut | 0.00–0.25% | −75 bp | 10–0 | Bernanke | Slowdown | −33 bp | |
| 28 Jan 2009 | scheduled | hold | 0.00–0.25% | 8–1 | Jeffrey M. Lacker | Bernanke | Slowdown | +28 bp | |
| 18 Mar 2009 | scheduled | hold | 0.00–0.25% | 10–0 | Bernanke | Slowdown | −41 bp | ||
| 29 Apr 2009 | scheduled | hold | 0.00–0.25% | 10–0 | Bernanke | Slowdown | +11 bp | ||
| 24 Jun 2009 | scheduled | hold | 0.00–0.25% | 10–0 | Bernanke | Slowdown | −10 bp | ||
| 12 Aug 2009 | scheduled | hold | 0.00–0.25% | 10–0 | Bernanke | Slowdown | −12 bp | ||
| 23 Sep 2009 | scheduled | hold | 0.00–0.25% | 10–0 | Bernanke | Transition / Mixed signals | −6 bp | ||
| 4 Nov 2009 | scheduled | hold | 0.00–0.25% | 10–0 | Bernanke | Transition / Mixed signals | +7 bp | ||
| 16 Dec 2009 | scheduled | hold | 0.00–0.25% | 10–0 | Bernanke | Transition / Mixed signals | −10 bp | ||
| 27 Jan 2010 | scheduled | hold | 0.00–0.25% | 9–1 | Thomas M. Hoenig | Bernanke | Transition / Mixed signals | +3 bp | |
| 16 Mar 2010 | scheduled | hold | 0.00–0.25% | 9–1 | Thomas M. Hoenig | Bernanke | Transition / Mixed signals | −6 bp | |
| 28 Apr 2010 | scheduled | hold | 0.00–0.25% | 9–1 | Thomas M. Hoenig | Bernanke | Transition / Mixed signals | +5 bp | |
| 23 Jun 2010 | scheduled | hold | 0.00–0.25% | 9–1 | Thomas M. Hoenig | Bernanke | Disinflationary Expansion | −4 bp | |
| 10 Aug 2010 | scheduled | hold | 0.00–0.25% | 9–1 | Thomas M. Hoenig | Bernanke | Transition / Mixed signals | −14 bp | |
| 21 Sep 2010 | scheduled | hold | 0.00–0.25% | 8–1 | Thomas M. Hoenig | Bernanke | Transition / Mixed signals | −16 bp | |
| 3 Nov 2010 | scheduled | hold | 0.00–0.25% | 10–1 | Thomas M. Hoenig | Bernanke | Transition / Mixed signals | −10 bp | |
| 14 Dec 2010 | scheduled | hold | 0.00–0.25% | 10–1 | Thomas M. Hoenig | Bernanke | Transition / Mixed signals | +24 bp | |
| 26 Jan 2011 | scheduled | hold | 0.00–0.25% | 11–0 | Bernanke | Transition / Mixed signals | +7 bp | ||
| 15 Mar 2011 | scheduled | hold | 0.00–0.25% | 10–0 | Bernanke | Transition / Mixed signals | −14 bp | ||
| 27 Apr 2011 | scheduled | hold | 0.00–0.25% | 10–0 | Bernanke | Transition / Mixed signals | 0 | ||
| 22 Jun 2011 | scheduled | hold | 0.00–0.25% | 10–0 | Bernanke | Transition / Mixed signals | −6 bp | ||
| 9 Aug 2011 | scheduled | hold | 0.00–0.25% | 7–3 | Richard W. Fisher, Narayana Kocherlakota, and Charles I. Plosser | Bernanke | Transition / Mixed signals | −23 bp | |
| 21 Sep 2011 | scheduled | hold | 0.00–0.25% | 7–3 | Richard W. Fisher, Narayana Kocherlakota, and Charles I. Plosser | Bernanke | Transition / Mixed signals | −23 bp | |
| 2 Nov 2011 | scheduled | hold | 0.00–0.25% | 9–1 | Charles L. Evans | Bernanke | Transition / Mixed signals | +8 bp | |
| 13 Dec 2011 | scheduled | hold | 0.00–0.25% | 9–1 | Charles L. Evans | Bernanke | Transition / Mixed signals | −11 bp | |
| 25 Jan 2012 | scheduled | hold | 0.00–0.25% | 9–1 | Jeffrey M. Lacker | Bernanke | Transition / Mixed signals | −12 bp | |
| 13 Mar 2012 | scheduled | hold | 0.00–0.25% | 9–1 | Jeffrey M. Lacker | Bernanke | Transition / Mixed signals | +25 bp | |
| 25 Apr 2012 | scheduled | hold | 0.00–0.25% | 9–1 | Jeffrey M. Lacker | Bernanke | Transition / Mixed signals | −2 bp | |
| 20 Jun 2012 | scheduled | hold | 0.00–0.25% | 11–1 | Jeffrey M. Lacker | Bernanke | Transition / Mixed signals | −1 bp | |
| 1 Aug 2012 | scheduled | hold | 0.00–0.25% | 11–1 | Jeffrey M. Lacker | Bernanke | Transition / Mixed signals | 0 | |
| 13 Sep 2012 | scheduled | hold | 0.00–0.25% | 11–1 | Jeffrey M. Lacker | Bernanke | Transition / Mixed signals | +11 bp | |
| 24 Oct 2012 | scheduled | hold | 0.00–0.25% | 11–1 | Jeffrey M. Lacker | Bernanke | Transition / Mixed signals | +7 bp | |
| 12 Dec 2012 | scheduled | hold | 0.00–0.25% | 11–1 | Jeffrey M. Lacker | Bernanke | Transition / Mixed signals | +8 bp | |
| 30 Jan 2013 | scheduled | hold | 0.00–0.25% | 11–1 | Esther L. George | Bernanke | Transition / Mixed signals | −1 bp | |
| 20 Mar 2013 | scheduled | hold | 0.00–0.25% | 11–1 | Esther L. George | Bernanke | Transition / Mixed signals | +3 bp | |
| 1 May 2013 | scheduled | hold | 0.00–0.25% | 11–1 | Esther L. George | Bernanke | Transition / Mixed signals | −4 bp | |
| 19 Jun 2013 | scheduled | hold | 0.00–0.25% | 10–1 | James Bullard | Bernanke | Transition / Mixed signals | +21 bp | |
| 31 Jul 2013 | scheduled | hold | 0.00–0.25% | 11–1 | Esther L. George | Bernanke | Transition / Mixed signals | +11 bp | |
| 18 Sep 2013 | scheduled | hold | 0.00–0.25% | 9–1 | Esther L. George | Bernanke | Transition / Mixed signals | −10 bp | |
| 30 Oct 2013 | scheduled | hold | 0.00–0.25% | 9–1 | Esther L. George | Bernanke | Transition / Mixed signals | +4 bp | |
| 18 Dec 2013 | scheduled | hold | 0.00–0.25% | 9–1 | Eric S. Rosengren | Bernanke | Balanced Expansion | +9 bp | |
| 29 Jan 2014 | scheduled | hold | 0.00–0.25% | 10–0 | Bernanke | Transition / Mixed signals | −5 bp | ||
| 19 Mar 2014 | scheduled | hold | 0.00–0.25% | 8–1 | Narayana Kocherlakota | Yellen | Transition / Mixed signals | +11 bp | |
| 30 Apr 2014 | scheduled | hold | 0.00–0.25% | 9–0 | Yellen | Transition / Mixed signals | −8 bp | ||
| 18 Jun 2014 | scheduled | hold | 0.00–0.25% | 10–0 | Yellen | Balanced Expansion | −2 bp | ||
| 30 Jul 2014 | scheduled | hold | 0.00–0.25% | 9–1 | Charles I. Plosser | Yellen | Balanced Expansion | +11 bp | |
| 17 Sep 2014 | scheduled | hold | 0.00–0.25% | 8–2 | Richard W. Fisher and Charles I. Plosser | Yellen | Transition / Mixed signals | +3 bp | |
| 29 Oct 2014 | scheduled | hold | 0.00–0.25% | 9–1 | Narayana Kocherlakota | Yellen | Transition / Mixed signals | +2 bp | |
| 17 Dec 2014 | scheduled | hold | 0.00–0.25% | 7–1 | Richard W. Fisher | Yellen | Balanced Expansion | +15 bp | |
| 28 Jan 2015 | scheduled | hold | 0.00–0.25% | 10–0 | Yellen | Balanced Expansion | −6 bp | ||
| 18 Mar 2015 | scheduled | hold | 0.00–0.25% | 10–0 | Yellen | Transition / Mixed signals | −8 bp | ||
| 29 Apr 2015 | scheduled | hold | 0.00–0.25% | 10–0 | Yellen | Transition / Mixed signals | +5 bp | ||
| 17 Jun 2015 | scheduled | hold | 0.00–0.25% | 10–0 | Yellen | Transition / Mixed signals | +3 bp | ||
| 29 Jul 2015 | scheduled | hold | 0.00–0.25% | 10–0 | Yellen | Transition / Mixed signals | +2 bp | ||
| 17 Sep 2015 | scheduled | hold | 0.00–0.25% | 9–1 | Jeffrey M. Lacker | Yellen | Transition / Mixed signals | −17 bp | |
| 28 Oct 2015 | scheduled | hold | 0.00–0.25% | 9–1 | Jeffrey M. Lacker | Yellen | Transition / Mixed signals | +14 bp | |
| 16 Dec 2015 | scheduled | hike | 0.25–0.50% | +25 bp | 10–0 | Yellen | Transition / Mixed signals | −4 bp | |
| 27 Jan 2016 | scheduled | hold | 0.25–0.50% | 10–0 | Yellen | Transition / Mixed signals | −1 bp | ||
| 16 Mar 2016 | scheduled | hold | 0.25–0.50% | 9–1 | Esther L. George | Yellen | Transition / Mixed signals | −6 bp | |
| 27 Apr 2016 | scheduled | hold | 0.25–0.50% | 9–1 | Esther L. George | Yellen | Transition / Mixed signals | −10 bp | |
| 15 Jun 2016 | scheduled | hold | 0.25–0.50% | 10–0 | Yellen | Transition / Mixed signals | −5 bp | ||
| 27 Jul 2016 | scheduled | hold | 0.25–0.50% | 9–1 | Esther L. George | Yellen | Transition / Mixed signals | −5 bp | |
| 21 Sep 2016 | scheduled | hold | 0.25–0.50% | 7–3 | Esther L. George, Loretta J. Mester, and Eric Rosengren, each of whom preferred at this me | Yellen | Transition / Mixed signals | −6 bp | |
| 2 Nov 2016 | scheduled | hold | 0.25–0.50% | 8–2 | Esther L. George and Loretta J. Mester, each of whom preferred at this meeting to raise th | Yellen | Transition / Mixed signals | −1 bp | |
| 14 Dec 2016 | scheduled | hike | 0.50–0.75% | +25 bp | 10–0 | Yellen | Transition / Mixed signals | +12 bp | |
| 1 Feb 2017 | scheduled | hold | 0.50–0.75% | 10–0 | Yellen | Transition / Mixed signals | +3 bp | ||
| 15 Mar 2017 | scheduled | hike | 0.75–1.00% | +25 bp | 9–1 | Neel Kashkari | Yellen | Transition / Mixed signals | −7 bp |
| 3 May 2017 | scheduled | hold | 0.75–1.00% | 9–0 | Yellen | Transition / Mixed signals | +7 bp | ||
| 14 Jun 2017 | scheduled | hike | 1.00–1.25% | +25 bp | 8–1 | Neel Kashkari | Yellen | Balanced Expansion | −5 bp |
| 26 Jul 2017 | scheduled | hold | 1.00–1.25% | 9–0 | Yellen | Balanced Expansion | −1 bp | ||
| 20 Sep 2017 | scheduled | hold | 1.00–1.25% | 9–0 | Yellen | Transition / Mixed signals | +3 bp | ||
| 1 Nov 2017 | scheduled | hold | 1.00–1.25% | 9–0 | Yellen | Balanced Expansion | −3 bp | ||
| 13 Dec 2017 | scheduled | hike | 1.25–1.50% | +25 bp | 7–2 | Charles L. Evans and Neel Kashkari | Yellen | Balanced Expansion | −5 bp |
| 31 Jan 2018 | scheduled | hold | 1.25–1.50% | 9–0 | Yellen | Balanced Expansion | +5 bp | ||
| 21 Mar 2018 | scheduled | hike | 1.50–1.75% | +25 bp | 8–0 | Powell | Balanced Expansion | −6 bp | |
| 2 May 2018 | scheduled | hold | 1.50–1.75% | 8–0 | Powell | Balanced Expansion | −3 bp | ||
| 13 Jun 2018 | scheduled | hike | 1.75–2.00% | +25 bp | 8–0 | Powell | Balanced Expansion | −2 bp | |
| 1 Aug 2018 | scheduled | hold | 1.75–2.00% | 8–0 | Powell | Balanced Expansion | +2 bp | ||
| 26 Sep 2018 | scheduled | hike | 2.00–2.25% | +25 bp | 9–0 | Powell | Balanced Expansion | −4 bp | |
| 8 Nov 2018 | scheduled | hold | 2.00–2.25% | 9–0 | Powell | Transition / Mixed signals | −3 bp | ||
| 19 Dec 2018 | scheduled | hike | 2.25–2.50% | +25 bp | 10–0 | Powell | Transition / Mixed signals | −3 bp | |
| 30 Jan 2019 | scheduled | hold | 2.25–2.50% | 10–0 | Powell | Transition / Mixed signals | −9 bp | ||
| 20 Mar 2019 | scheduled | hold | 2.25–2.50% | 10–0 | Powell | Transition / Mixed signals | −7 bp | ||
| 1 May 2019 | scheduled | hold | 2.25–2.50% | 10–0 | Powell | Transition / Mixed signals | +4 bp | ||
| 19 Jun 2019 | scheduled | hold | 2.25–2.50% | 9–1 | James Bullard | Powell | Transition / Mixed signals | −5 bp | |
| 31 Jul 2019 | scheduled | cut | 2.00–2.25% | −25 bp | 8–2 | Esther L. George and Eric S. Rosengren | Powell | Transition / Mixed signals | −16 bp |
| 18 Sep 2019 | scheduled | cut | 1.75–2.00% | −25 bp | 7–3 | James Bullard | Powell | Transition / Mixed signals | −2 bp |
| 30 Oct 2019 | scheduled | cut | 1.50–1.75% | −25 bp | 8–2 | Esther L. George and Eric S. Rosengren | Powell | Transition / Mixed signals | −15 bp |
| 11 Dec 2019 | scheduled | hold | 1.50–1.75% | 10–0 | Powell | Transition / Mixed signals | +5 bp | ||
| 29 Jan 2020 | scheduled | hold | 1.50–1.75% | 10–0 | Powell | Transition / Mixed signals | −8 bp | ||
| 2 Mar 2020 | unscheduled | cut | 1.00–1.25% | −50 bp | 10–0 | Powell | Transition / Mixed signals | −11 bp | |
| 15 Mar 2020 | unscheduled | cut | 0.00–0.25% | −100 bp | 9–1 | Loretta J. Mester | Powell | Transition / Mixed signals | −21 bp |
| 29 Apr 2020 | scheduled | hold | 0.00–0.25% | 10–0 | Powell | Slowdown | +2 bp | ||
| 10 Jun 2020 | scheduled | hold | 0.00–0.25% | 10–0 | Powell | Slowdown | −18 bp | ||
| 29 Jul 2020 | scheduled | hold | 0.00–0.25% | 10–0 | Powell | Slowdown | −4 bp | ||
| 16 Sep 2020 | scheduled | hold | 0.00–0.25% | 8–2 | Robert S. Kaplan | Powell | Balanced Expansion | +1 bp | |
| 5 Nov 2020 | scheduled | hold | 0.00–0.25% | 10–0 | Powell | Balanced Expansion | +5 bp | ||
| 16 Dec 2020 | scheduled | hold | 0.00–0.25% | 10–0 | Powell | Balanced Expansion | +2 bp | ||
| 27 Jan 2021 | scheduled | hold | 0.00–0.25% | 11–0 | Powell | Balanced Expansion | +2 bp | ||
| 17 Mar 2021 | scheduled | hold | 0.00–0.25% | 11–0 | Powell | Balanced Expansion | +9 bp | ||
| 28 Apr 2021 | scheduled | hold | 0.00–0.25% | 11–0 | Powell | Balanced Expansion | +2 bp | ||
| 16 Jun 2021 | scheduled | hold | 0.00–0.25% | 11–0 | Powell | Balanced Expansion | +1 bp | ||
| 28 Jul 2021 | scheduled | hold | 0.00–0.25% | 11–0 | Powell | Balanced Expansion | +3 bp | ||
| 22 Sep 2021 | scheduled | hold | 0.00–0.25% | 11–0 | Powell | Balanced Expansion | +8 bp | ||
| 3 Nov 2021 | scheduled | hold | 0.00–0.25% | 11–0 | Powell | Overheating | −3 bp | ||
| 15 Dec 2021 | scheduled | hold | 0.00–0.25% | 11–0 | Powell | Overheating | 0 | ||
| 26 Jan 2022 | scheduled | hold | 0.00–0.25% | 9–0 | Powell | Overheating | +3 bp | ||
| 16 Mar 2022 | scheduled | hike | 0.25–0.50% | +25 bp | 8–1 | James Bullard | Powell | Overheating | +5 bp |
| 4 May 2022 | scheduled | hike | 0.75–1.00% | +50 bp | 9–0 | Powell | Overheating | +8 bp | |
| 15 Jun 2022 | scheduled | hike | 1.50–1.75% | +75 bp | 10–1 | Esther L. George | Powell | Inflationary Pressure | −21 bp |
| 27 Jul 2022 | scheduled | hike | 2.25–2.50% | +75 bp | 12–0 | Powell | Inflationary Pressure | −13 bp | |
| 21 Sep 2022 | scheduled | hike | 3.00–3.25% | +75 bp | 12–0 | Powell | Inflationary Pressure | +13 bp | |
| 2 Nov 2022 | scheduled | hike | 3.75–4.00% | +75 bp | 12–0 | Powell | Inflationary Pressure | +7 bp | |
| 14 Dec 2022 | scheduled | hike | 4.25–4.50% | +50 bp | 12–0 | Powell | Inflationary Pressure | −7 bp | |
| 1 Feb 2023 | scheduled | hike | 4.50–4.75% | +25 bp | 12–0 | Powell | Inflationary Pressure | −12 bp | |
| 22 Mar 2023 | scheduled | hike | 4.75–5.00% | +25 bp | 11–0 | Powell | Inflationary Pressure | −21 bp | |
| 3 May 2023 | scheduled | hike | 5.00–5.25% | +25 bp | 11–0 | Powell | Inflationary Pressure | −7 bp | |
| 14 Jun 2023 | scheduled | hold | 5.00–5.25% | 11–0 | Powell | Inflationary Pressure | −12 bp | ||
| 26 Jul 2023 | scheduled | hike | 5.25–5.50% | +25 bp | 11–0 | Powell | Inflationary Pressure | +10 bp | |
| 20 Sep 2023 | scheduled | hold | 5.25–5.50% | 12–0 | Powell | Inflationary Pressure | +12 bp | ||
| 1 Nov 2023 | scheduled | hold | 5.25–5.50% | 12–0 | Powell | Inflationary Pressure | −21 bp | ||
| 13 Dec 2023 | scheduled | hold | 5.25–5.50% | 12–0 | Powell | Inflationary Pressure | −28 bp | ||
| 31 Jan 2024 | scheduled | hold | 5.25–5.50% | 12–0 | Powell | Inflationary Pressure | −19 bp | ||
| 20 Mar 2024 | scheduled | hold | 5.25–5.50% | 12–0 | Powell | Inflationary Pressure | −3 bp | ||
| 1 May 2024 | scheduled | hold | 5.25–5.50% | 12–0 | Powell | Inflationary Pressure | −11 bp | ||
| 12 Jun 2024 | scheduled | hold | 5.25–5.50% | 12–0 | Powell | Inflationary Pressure | −15 bp | ||
| 31 Jul 2024 | scheduled | hold | 5.25–5.50% | 12–0 | Powell | Stagflation | −16 bp | ||
| 18 Sep 2024 | scheduled | cut | 4.75–5.00% | −50 bp | 11–1 | Michelle W. Bowman | Powell | Inflationary Pressure | +8 bp |
| 7 Nov 2024 | scheduled | cut | 4.50–4.75% | −25 bp | 12–0 | Powell | Inflationary Pressure | −12 bp | |
| 18 Dec 2024 | scheduled | cut | 4.25–4.50% | −25 bp | 11–1 | Beth M. Hammack | Powell | Inflationary Pressure | +17 bp |
| 29 Jan 2025 | scheduled | hold | 4.25–4.50% | 12–0 | Powell | Inflationary Pressure | −3 bp | ||
| 19 Mar 2025 | scheduled | hold | 4.25–4.50% | 11–1 | Christopher J. Waller | Powell | Transition / Mixed signals | −5 bp | |
| 7 May 2025 | scheduled | hold | 4.25–4.50% | 12–0 | Powell | Transition / Mixed signals | +7 bp | ||
| 18 Jun 2025 | scheduled | hold | 4.25–4.50% | 12–0 | Powell | Transition / Mixed signals | −1 bp | ||
| 30 Jul 2025 | scheduled | hold | 4.25–4.50% | 9–2 | Michelle W. Bowman and Christopher J. Waller | Powell | Transition / Mixed signals | +3 bp | |
| 17 Sep 2025 | scheduled | cut | 4.00–4.25% | −25 bp | 11–1 | Stephen I. Miran | Powell | Transition / Mixed signals | +7 bp |
| 29 Oct 2025 | scheduled | cut | 3.75–4.00% | −25 bp | 10–1 | Stephen I. Miran | Powell | Transition / Mixed signals | +12 bp |
| 10 Dec 2025 | scheduled | cut | 3.50–3.75% | −25 bp | 9–3 | Stephen I. Miran | Powell | Transition / Mixed signals | −4 bp |
| 28 Jan 2026 | scheduled | hold | 3.50–3.75% | 10–2 | Stephen I. Miran and Christopher J. Waller | Powell | Transition / Mixed signals | 0 | |
| 18 Mar 2026 | scheduled | hold | 3.50–3.75% | 11–1 | Stephen I. Miran | Powell | Transition / Mixed signals | +5 bp | |
| 29 Apr 2026 | scheduled | hold | 3.50–3.75% | 8–4 | Stephen I. Miran | Powell | Transition / Mixed signals | +4 bp | |
| 17 Jun 2026 | scheduled | hold | 3.50–3.75% | 12–0 | Warsh | Transition / Mixed signals | +3 bp | ||
| 29 Jul 2026 | scheduled | hold | 3.50–3.75% | 9–3 | Beth M. Hammack, Neel Kashkari, and Lorie K. Logan | Warsh | Transition / Mixed signals | +7 bp | |
| 16 Sep 2026 | scheduled | hike | 3.75–4.00% | +25 bp | 12–0 | Warsh | Transition / Mixed signals | n.d. |
Fourteen cycles
A cycle starts at the first move that reverses the direction of the previous one and ends at the last move in that direction; the holds inside it are counted. Fourteen cycles since 1990, seven hiking and seven cutting. The current one, opened on 16 September 2026, is the fourteenth: one move so far.
| # | Direction | First move | Last move | Moves | Holds inside | Total | From | To | Days | Chair |
|---|---|---|---|---|---|---|---|---|---|---|
| 1 | cutting | 13 Jul 1990 | 4 Sep 1992 | 18 | 13 | −525 bp | 8.25% | 3.00% | 784 | Greenspan |
| 2 | hiking | 4 Feb 1994 | 1 Feb 1995 | 7 | 3 | +300 bp | 3.00% | 6.00% | 362 | Greenspan |
| 3 | cutting | 6 Jul 1995 | 31 Jan 1996 | 3 | 3 | −75 bp | 6.00% | 5.25% | 209 | Greenspan |
| 4 | hiking | 25 Mar 1997 | 25 Mar 1997 | 1 | 0 | +25 bp | 5.25% | 5.50% | 0 | Greenspan |
| 5 | cutting | 29 Sep 1998 | 17 Nov 1998 | 3 | 0 | −75 bp | 5.50% | 4.75% | 49 | Greenspan |
| 6 | hiking | 30 Jun 1999 | 16 May 2000 | 6 | 2 | +175 bp | 4.75% | 6.50% | 321 | Greenspan |
| 7 | cutting | 3 Jan 2001 | 25 Jun 2003 | 13 | 10 | −550 bp | 6.50% | 1.00% | 903 | Greenspan |
| 8 | hiking | 30 Jun 2004 | 29 Jun 2006 | 17 | 0 | +425 bp | 1.00% | 5.25% | 729 | Bernanke, Greenspan |
| 9 | cutting | 18 Sep 2007 | 16 Dec 2008 | 10 | 3 | −500 bp | 5.25% | 0.25% | 455 | Bernanke |
| 10 | hiking | 16 Dec 2015 | 19 Dec 2018 | 9 | 16 | +225 bp | 0.25% | 2.50% | 1099 | Powell, Yellen |
| 11 | cutting | 31 Jul 2019 | 15 Mar 2020 | 5 | 2 | −225 bp | 2.50% | 0.25% | 228 | Powell |
| 12 | hiking | 16 Mar 2022 | 26 Jul 2023 | 11 | 1 | +525 bp | 0.25% | 5.50% | 497 | Powell |
| 13 | cutting | 18 Sep 2024 | 10 Dec 2025 | 6 | 5 | −175 bp | 5.50% | 3.75% | 448 | Powell |
| 14 | hiking | 16 Sep 2026 | 16 Sep 2026* | 1 | 0 | +25 bp | 3.75% | 4.00% | 0 | Warsh |
* Cycle in progress as of 16 Sep 2026: the last move is the latest decision, not the end of the cycle.
Two cycles stand apart. The 1990–92 cutting cycle, 18 moves for -525 basis points, was carried out with 14 of its moves outside scheduled meetings and none of them announced. The 2022–23 hiking cycle, 11 moves for +525 points in 497 days with a single pause, is the largest in the register; the 2004–06 cycle took 17 moves and 729 days for +425 points, never more than 25 at a time.
Who dissented, and which way
The FOMC publishes a roll call. Of the 292 decisions with a recorded vote, 181 were unanimous and 111 had at least one dissent: 81 with one dissenter, 22 with two, 6 with three, 2 with four. The two four-dissent votes are 2 October 1990, 7–4, and 29 April 2026, 8–4. The register reads the side of each dissenter from the statement: hawkish when they wanted a higher rate than the decision, dovish when they wanted a lower one, mixed when both sides dissented at the same meeting, other when the objection was about guidance or asset purchases rather than the rate.
The chart below plots every split vote on the path of the target rate. Pick a chair or a side; hover a marker for the date, the vote and the names.
The pattern by chair is the one the chart shows. Ben Bernanke faced a dissent at 41 of his 66 meetings, 62%, most of them in 2011–13 over forward guidance and asset purchases, when the target itself did not move for seven years. Alan Greenspan, 148 meetings, 24%. Janet Yellen, 32 meetings, 47%. Jerome Powell, 67 meetings, 27%, with a run of nine dissents in the last fourteen meetings of his chairmanship and the 8–4 vote of April 2026. Kevin Warsh has chaired 3 meetings, one of them with three dissenters, the hawks of July 2026, before the unanimous 12–0 hike of September.
The register describes a committee whose disagreements are the rule, not the exception, and whose dissents cluster when the rate is not moving: the argument is about the words. The 8–4 of April 2026 is unusual for its arithmetic, not for its existence.
What this does not prove
A dissent is a vote, not a forecast: the register does not say whether the dissenters were right, and a hawkish dissent in 2011 concerned the phrase “exceptionally low levels for an extended period”, not a rate. The count of dissents is not comparable across eras without care: the Committee had between eight and twelve voting members depending on Board vacancies, so 7–4 in 1990 and 8–4 in 2026 are the same number of dissenters against a different total. The side of a dissent is read from the statement wording by rule; forty-three dissents are classed as other because the wording does not name a rate, and the CSV keeps the sentence for each one. Before February 1994 the register dates changes by the Desk’s implementation, which is not the day the Committee decided. The regime column is the eco3min classifier’s reading of the month, with degraded inputs before 2003, and the 10-year column measures two closes, not the effect of the decision.
Method, and the register itself
Primary sources. The Federal Reserve’s “Open market operations” tables for every change of the target since 1990, 110 rows; the FOMC historical materials by year (1990–2020) and the meeting calendars (2021–2026) for the list of meetings and conference calls; the FOMC statements for the vote from March 2002, the minutes from 1993 to January 2002, the Records of Policy Actions for 1990–1992; the June 2026 minutes for the names behind the new statement format. FRED DGS10 via eco3min for the 10-year yield, the eco3min regime classifier for the monthly regime. Retrieved 19 September 2026.
Rules. One row per scheduled meeting, plus each unscheduled meeting or conference call that changed the target, plus each change implemented between meetings. The 15 September 2003 special meeting and the cancelled meeting of March 2020 are not rows. A change dated by the Desk on the day after a meeting is attached to that meeting. The target before 13 July 1990 is 8.25%%, read from the first entry of the table. Direction and size are those of the target, then of the upper bound of the range. A cycle is a run of moves in the same direction; a hold is measured from the last move of a cycle to the first move of the next. The vote is the count of names for and against on the policy action; the side of a dissent is read from the sentence that carries the preference. Regime: month of the decision in the classifier’s history file. Twenty-four rows have no vote: the changes implemented between meetings in 1990–1992, the conference calls of 1990–91, 1994, 1998 and 2001, and five meetings whose minutes are incomplete online (1992–93 and November 1999).
Questions about the register
How many times has the Fed changed rates since 1990?
110 times between July 1990 and September 2026: 52 hikes and 58 cuts, over 316 decisions. The other 206 decisions left the target unchanged.
What was the most divided FOMC vote?
Two votes with four dissenters: 2 October 1990, 7–4, and 29 April 2026, 8–4. In April 2026 one dissenter wanted a cut and three objected to the easing bias in the statement, so the register classes it as mixed.
How often does the FOMC vote unanimously?
181 of the 292 recorded votes, 62%. The share varies by chair: 62% of Ben Bernanke’s meetings had a dissent, 24% of Alan Greenspan’s, 47% of Janet Yellen’s, 27% of Jerome Powell’s.
What is the Fed’s longest hold?
2,556 days at 0–0.25%, from the cut of 16 December 2008 to the hike of 16 December 2015, 55 consecutive meetings without a change. The second longest is 731 days at 0–0.25% again, from March 2020 to March 2022.
What is the Fed’s latest rate decision?
16 September 2026: a 25 basis point hike to 3.75–4.00%, by a 12–0 vote, the first hike since July 2023 and the first move up 280 days after the last cut of 10 December 2025.
Read next on the site: the next FOMC meeting and the time of the decision, every ECB rate decision since 1999, the fed funds rate as the central signal of monetary policy, a typology of Fed hiking and cutting cycles since 1954, the Fed’s track record against the Taylor rule, every Fed cut into a rising market since 1984, Fed vs ECB, two mandates compared and the effective fed funds rate as a monthly dataset. The wider frame is the central banks and monetary policy sub-pillar of the monetary regimes and rate cycles pillar.
Last updated — 19 September 2026
Disclaimer – Financial Information: The analyses, commentary, and content published on eco3min.fr are provided for informational and educational purposes only. They do not constitute investment advice or a solicitation to buy or sell financial instruments. Past performance is not indicative of future results. All investment decisions involve risk and are the sole responsibility of the reader.