
Inverted Yield Curve, No Recession: What a Real-Time Model Showed, 1976-2026
The 2022-24 inversion of the US 10-year/3-month Treasury spread lasted 25 months, from November 2022 to November 2024, the longest since 1953. It bottomed at −1.57 pt in May 2023, a depth the spread had not reached since May 1981. As of November 2026, the FRED recession indicator shows no recession month since April 2020 (USREC, series through October 2026).
What a real-time yield-curve model would have shown, 1976–2026
Probability of being in recession 12 months later, re-estimated monthly on data then available. Shaded: US recessions (FRED USREC).
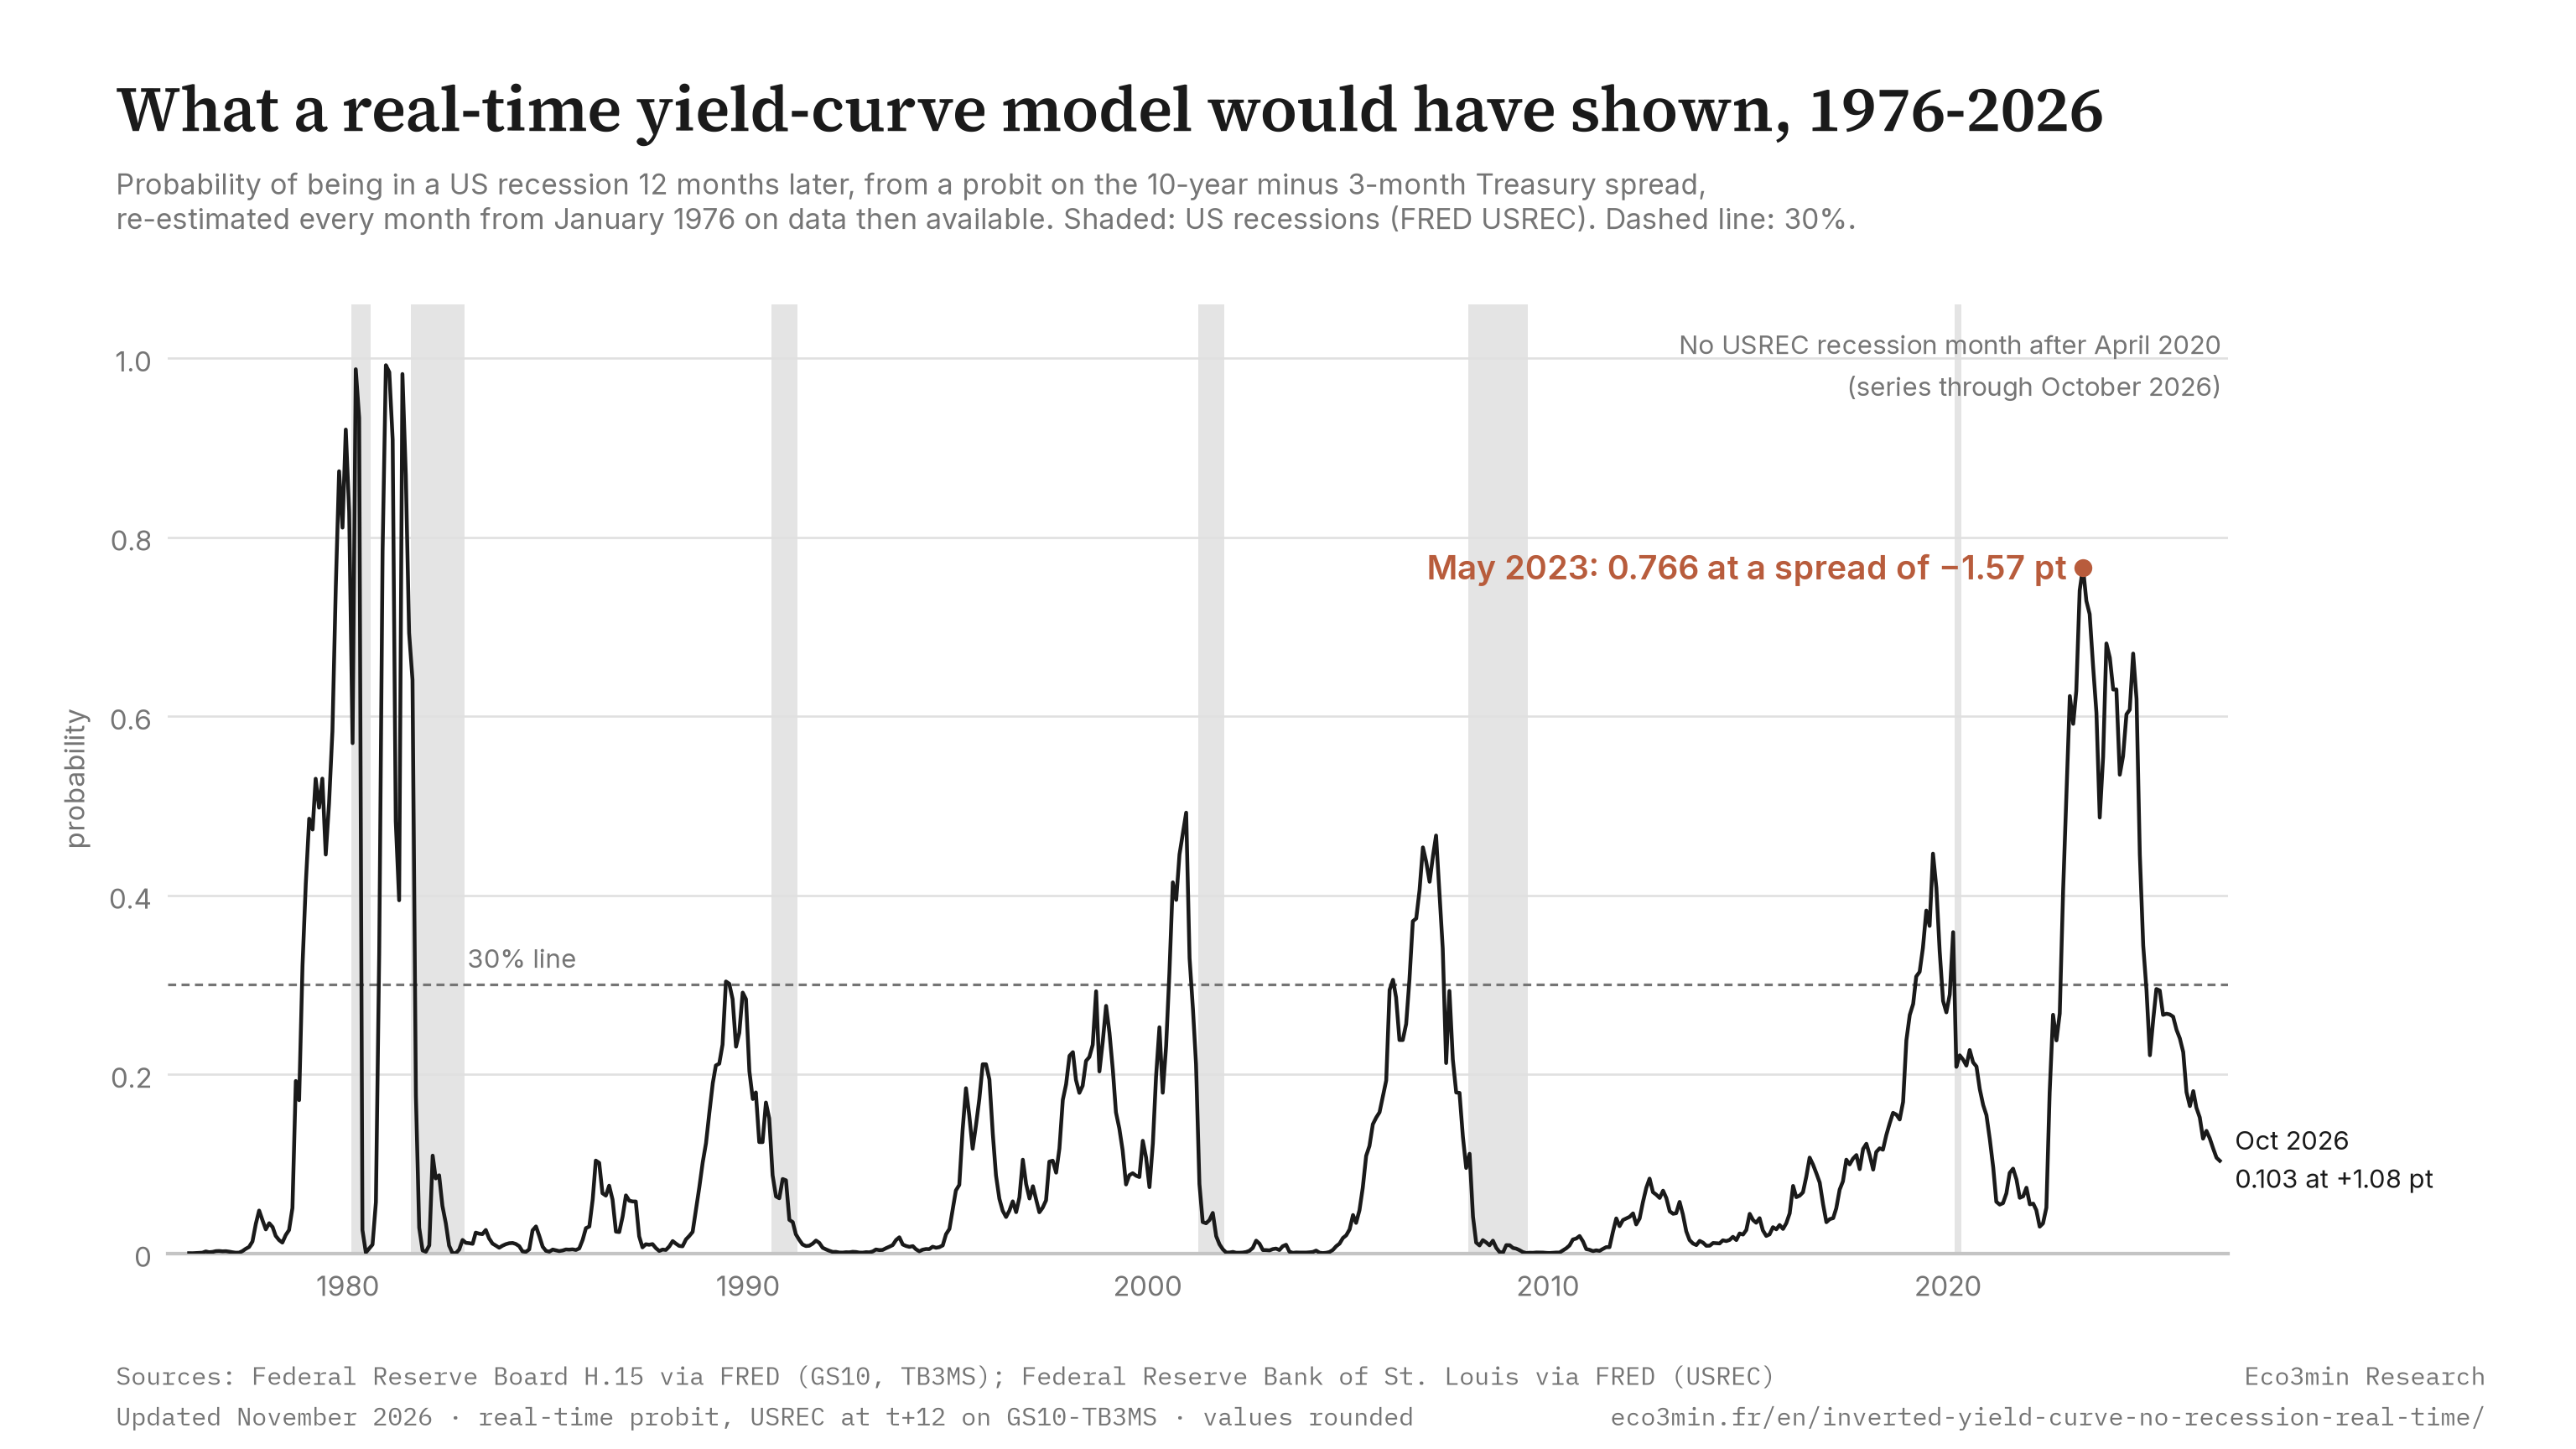
Source: Federal Reserve Board H.15 (GS10, TB3MS) and Federal Reserve Bank of St. Louis (USREC), via FRED, retrieved 3 November 2026. Probit re-estimated monthly by Eco3min Research.
Until 2021 the curve beat the base rate; 2022-24 erased at least half its lead. Eco3min Research re-estimated a probit on the spread every month from January 1976, with recession dates lagged 12 months as a stand-in for when they became known, and scored each reading against the recession frequency known under the same lag. The 10-year/3-month spread dataset tracks the series itself, and the monthly file behind this study is free to download below.
Inverted yield curve no recession: as of November 2026, that is the record of the US 10-year/3-month Treasury spread since its November 2022 inversion. Re-estimated monthly on data then available, a probit model on this spread would have shown a probability of 0.766 of being in recession 12 months later in May 2023, at a spread of −1.57 pt. The FRED recession indicator, USREC, shows no recession month from May 2020 through October 2026. Against the historical base rate, the model’s cumulative Brier advantage fell from 12.48 at the end of 2021 to 2.95 in October 2025.
TL;DR
A yield-curve recession model re-estimated monthly since 1976 beat the historical base rate until 2021; the 2022-24 inversion erased at least half of that edge.
- Ex ante, the edge was measurable. From 1991 to 2021 the Brier skill score was +0.212 (90% interval +0.079 to +0.447, 28 recession target months).
- Over the full evaluation, 598 monthly origins and 6 recessions, the score is +0.054 (90% interval −0.326 to +0.308), not statistically distinguishable from the base rate.
- May 2023 would have shown 0.766 at −1.57 pt, third of 7 episode peaks, below the readings ahead of the 1980 recession (0.920 in December 1979, at −1.65 pt) and the 1981 recession (0.992 in December 1980, at −2.65 pt).
- Same sign if the lag, the window or the rate convention changes: all five variants keep a positive cumulative edge in October 2025, cut by 50.2% (20-year rolling window) to 77.1% (6-month information lag).
Scope: two Treasury yields and the FRED recession indicator, no market returns and no forecast. Details in the methodology and the limitations.
Latest observation
10-year/3-month spread, October 2026
+1.08 pt
GS10 at 5.13%, TB3MS at 4.05%. On a bond-equivalent basis the spread is +0.98 pt.
Real-time probability
0.103
Probability of being in recession 12 months later, at a spread of +1.08 pt, against a known recession frequency of 0.122.
Spread for a 30% reading
−0.17 pt
With the coefficients estimated in October 2026. A 50% reading needs −1.06 pt, and a flat curve gives 0.266.
Months since the last USREC recession month
78
Last recession month April 2020. Last negative spread November 2024, 23 months before October 2026.
Data as of 3 November 2026, FRED observations through October 2026. Updated monthly.
Summary
Six findings
- A yield-curve recession model re-estimated monthly since 1976 beat the historical base rate until 2021; the 2022-24 inversion erased at least half of that edge.
- The 2023 reading was not the highest on record. May 2023 would have shown 0.766 at −1.57 pt, third of 7 episode peaks behind the readings ahead of the 1981 recession (0.992 in December 1980, at −2.65 pt) and the 1980 recession (0.920 in December 1979, at −1.65 pt). Across the 7, the probability ranks exactly as the depth of the spread (Spearman −1.000).
- The edge held ex ante. From 1991 to 2021, with the model already in print, the Brier skill score was +0.212 (90% interval +0.079 to +0.447, Diebold-Mariano p 0.019), after +0.251 from 1976 to 1990 (−0.046 to +0.555).
- As of November 2026, USREC shows no recession month since April 2020. The 30% episode that began in November 2022 is judged a false positive under the 36-month rule, and the 50% episode that began in November 2023 stays pending until USREC covers November 2026.
- Over the full evaluation, 598 origins and 6 recessions, the score is +0.054 (90% interval −0.326 to +0.308, P(BSS ≤ 0) 0.347): not statistically distinguishable from the base rate. The Clark-West test still finds information in the spread (t 2.90, p 0.002).
- The file holds 883 monthly rows from April 1953 to October 2026, with the five probability variants and their benchmarks, and its model columns can be rebuilt from the spread and USREC columns with the code in the methodology. Eco3min text and analysis: CC BY 4.0. Data, files and charts remain subject to their producer’s terms, stated on each page; Eco3min grants no licence over third-party data. USREC is copyrighted and published with a citation requirement, while GS10 and TB3MS are in the public domain.
The real-time record in six numbers
+0.212
Brier skill score from 1991 to 2021, after the model was published (90% interval +0.079 to +0.447)
+0.054
Score over the full evaluation, 6 recessions, not statistically distinguishable from the base rate
76.4%
Share of the end-2021 cumulative edge gone by October 2025, base model (50.2% to 77.1% across variants)
0.766
Peak reading in May 2023, at a spread of −1.57 pt, third of 7 episode peaks
25 months
Length of the 2022-24 inversion, the longest since 1953 (rank 1 of 13 runs)
6/6
Recessions preceded by a 30% crossing, median lead 13.0 months, 1 judgeable false positive (2022-11)
What the probability is and is not
The line in the chart at the top is the probability of being in recession 12 months later. Formally, it is the model’s estimate that USREC equals 1 in month t+12, given the spread in month t. It does not give the probability that a recession starts at some point in the next 12 months. On the in-sample replication described below, that second target fits less well, with a pseudo-R² of 0.072 against 0.137 for the t+12 target (408 monthly origins).
The reading has one input. The spread, explained in what the 10-year/3-month Treasury spread measures, enters a probit with two coefficients that are re-estimated each month. For a given month’s coefficients, the probability depends on the spread alone. Across the 7 episodes in the evaluation, the peak probabilities rank exactly as the spreads at those peaks (Spearman −1.000). The model adds a calibration to the spread and leaves the order of the episodes unchanged.
Calibration is where the model earns or loses its keep. In the 41 months where it would have shown 0.5 or more, the average reading was 0.707, and the share of those months followed by a recession month 12 months later was 0.268. In the 0.3 to 0.5 band the two were near each other, 0.395 against 0.419 over 43 months.
| Probability band | Monthly origins | Mean probability | Observed share in recession at t+12 | Recession target months |
|---|---|---|---|---|
| 0 to 0.1 | 380 | 0.026 | 0.026 | 10 |
| 0.1 to 0.2 | 73 | 0.145 | 0.110 | 8 |
| 0.2 to 0.3 | 61 | 0.246 | 0.180 | 11 |
| 0.3 to 0.5 | 43 | 0.395 | 0.419 | 18 |
| 0.5 to 1.0 | 41 | 0.707 | 0.268 | 11 |
Base model (12-month information lag), evaluation filter. Each band includes its lower bound and excludes its upper bound.
The steep end of the curve rests on few months. Since 1953 the spread has been below −1.50 pt in 8 months: 7 fell in 1979, 1980 and 1981, the eighth in 2023. A reading of 0.766 at −1.57 pt in May 2023 reflects what the model learned from those three years.
How to read the chart: the line is the reading each month would have produced, the grey bands are USREC recession months, and the horizontal line marks 30%, the threshold crossed before each of the 6 evaluated recessions. The marker sits on May 2023, the peak of the 2022-24 cycle.
What this dataset does not measure
The file holds two Treasury yields and a binary recession flag. It does not measure output, employment or credit, and USREC marks only the months between an NBER peak and trough. A slowdown the NBER does not date stays at 0, as after the 1966-67 inversion (trough −0.34 pt in October 1966). The file does not measure the term premium either, so a 10-year yield held down by bond purchases and one held down by expected rate cuts look the same to the model.
The edge the model built from 1976 to 2021
The case for the curve rests on a long record. Eco3min’s Q&A on why the yield curve inverts and its comparison of how accurate recession indicators have been both cover the curve’s record before recent US recessions. This study does not revisit that history. It asks what a model fitted only on data available at each date would have shown.
One replication comes first. The analysis of the New York Fed recession probability model reports an in-sample pseudo-R² of 15.6% on 408 months. Fitted on this study’s monthly file over 1990-2024, the same probit gives 0.137 with the t+12 target (31 recession months among 408) and 0.143 on the bond-equivalent spread. The 2-month inversion rule finds 3 true positives and 1 false positive (2022-11) over the same years, matching the four sustained episodes that page counts. Its six true positives come from daily T10Y3M data, where re-inversions count separately. The remaining gap is consistent with a different 3-month series and a different way of counting the target, and the T10Y3M probit walkthrough sets out the in-sample version. From here on, the study uses out-of-sample readings only.
The out-of-sample test begins in January 1976. At each date t, the probit uses only pairs whose outcome month falls at least 12 months before t, a stand-in for the delay in dating recessions. Split at the publication of this model in 1989-1991, the record holds on both sides. From 1976 to 1990, before journal publication, the Brier skill score against the base rate was +0.251 (90% interval −0.046 to +0.555, 30 recession target months). From 1991 to 2021, with the specification already in print, it was +0.212 (+0.079 to +0.447, 28 target months). The Diebold-Mariano test rejects equal accuracy in that second segment (t 2.07, p 0.019).
| Segment | Origins | Recession target months | BSS | 90% interval | P(BSS ≤ 0) | Pseudo-R² | AUC | DM t (p) | CW t (p) |
|---|---|---|---|---|---|---|---|---|---|
| 1976-1990 | 180 | 30 | +0.251 | −0.046 to +0.555 | 0.070 | +0.234 | 0.870 | +1.02 (0.153) | +2.41 (0.008) |
| 1991-2021 | 372 | 28 | +0.212 | +0.079 to +0.447 | 0.008 | +0.249 | 0.816 | +2.07 (0.019) | +3.65 (0.000) |
| 1991-latest | 418 | 28 | −0.122 | −0.959 to +0.252 | 0.642 | +0.046 | 0.752 | not run | not run |
| 1976-2021 | 552 | 58 | +0.231 | not run | not run | +0.243 | 0.849 | not run | not run |
| Evaluation (full) | 598 | 58 | +0.054 | −0.326 to +0.308 | 0.347 | +0.124 | 0.809 | +0.31 (0.378) | +2.90 (0.002) |
| ex-2018-2020 | 562 | 56 | +0.073 | not run | not run | +0.143 | 0.817 | not run | not run |
| Provisional cut | 580 | 58 | +0.103 | not run | not run | +0.160 | 0.823 | not run | not run |
Base model, 12-month information lag. The full evaluation covers 6 recessions. No skill score is published for the 2022-24 window alone, which has no recession target: the cumulative edge chart below shows that period instead.
Threshold readings tell the same story. Every 30% crossing before 2022 was followed by a recession start within 24 months: 8 true positives, covering all 6 evaluated recessions, with a median lead of 13.0 months (9 to 23). The 2020 recession is an exogenous shock, the pandemic, counted by protocol. Dropping origins from 2018 to 2020 raises the full-sample score from +0.054 to +0.073.
Takeaway
Before 2022 the model added information to the base rate out of sample. Both ex ante segments show positive skill, no 30% crossing came without a recession, and the Clark-West test rejects the base rate alone (t 2.41, p 0.008, for 1976-1990 and t 3.65, p 0.000, for 1991-2021).
What 2022-24 did to that edge
This study started from a different claim, that the May 2023 reading stood above the reading before every recession on record. The data do not support it. At 0.766 and −1.57 pt, May 2023 is third of 7 episode peaks, below the readings ahead of the 1981 recession (0.992 in December 1980, at −2.65 pt) and the 1980 recession (0.920 in December 1979, at −1.65 pt). It stands above the peaks ahead of the 2001 (0.492 at −0.53 pt), 2008 (0.467 at −0.38 pt), 2020 (0.446 at −0.32 pt) and 1990 (0.304 at +0.13 pt) recessions. What holds in all five variants is the erosion of the cumulative edge.
The sequence ran as follows. The base model crossed 30% in November 2022 (0.406 at −0.26 pt) and 50% in December 2022 (0.513 at −0.63 pt), then peaked in May 2023. It crossed 50% again in November 2023 (0.555 at −0.77 pt) and still read 0.344 in November 2024, the last negative month (−0.06 pt). USREC recorded no recession month in that window or after it, through October 2026.
The cumulative edge over the base rate, 1976–2025
Brier score of the known recession frequency minus Brier score of the model, summed over monthly origins. Above zero, the model scored better.
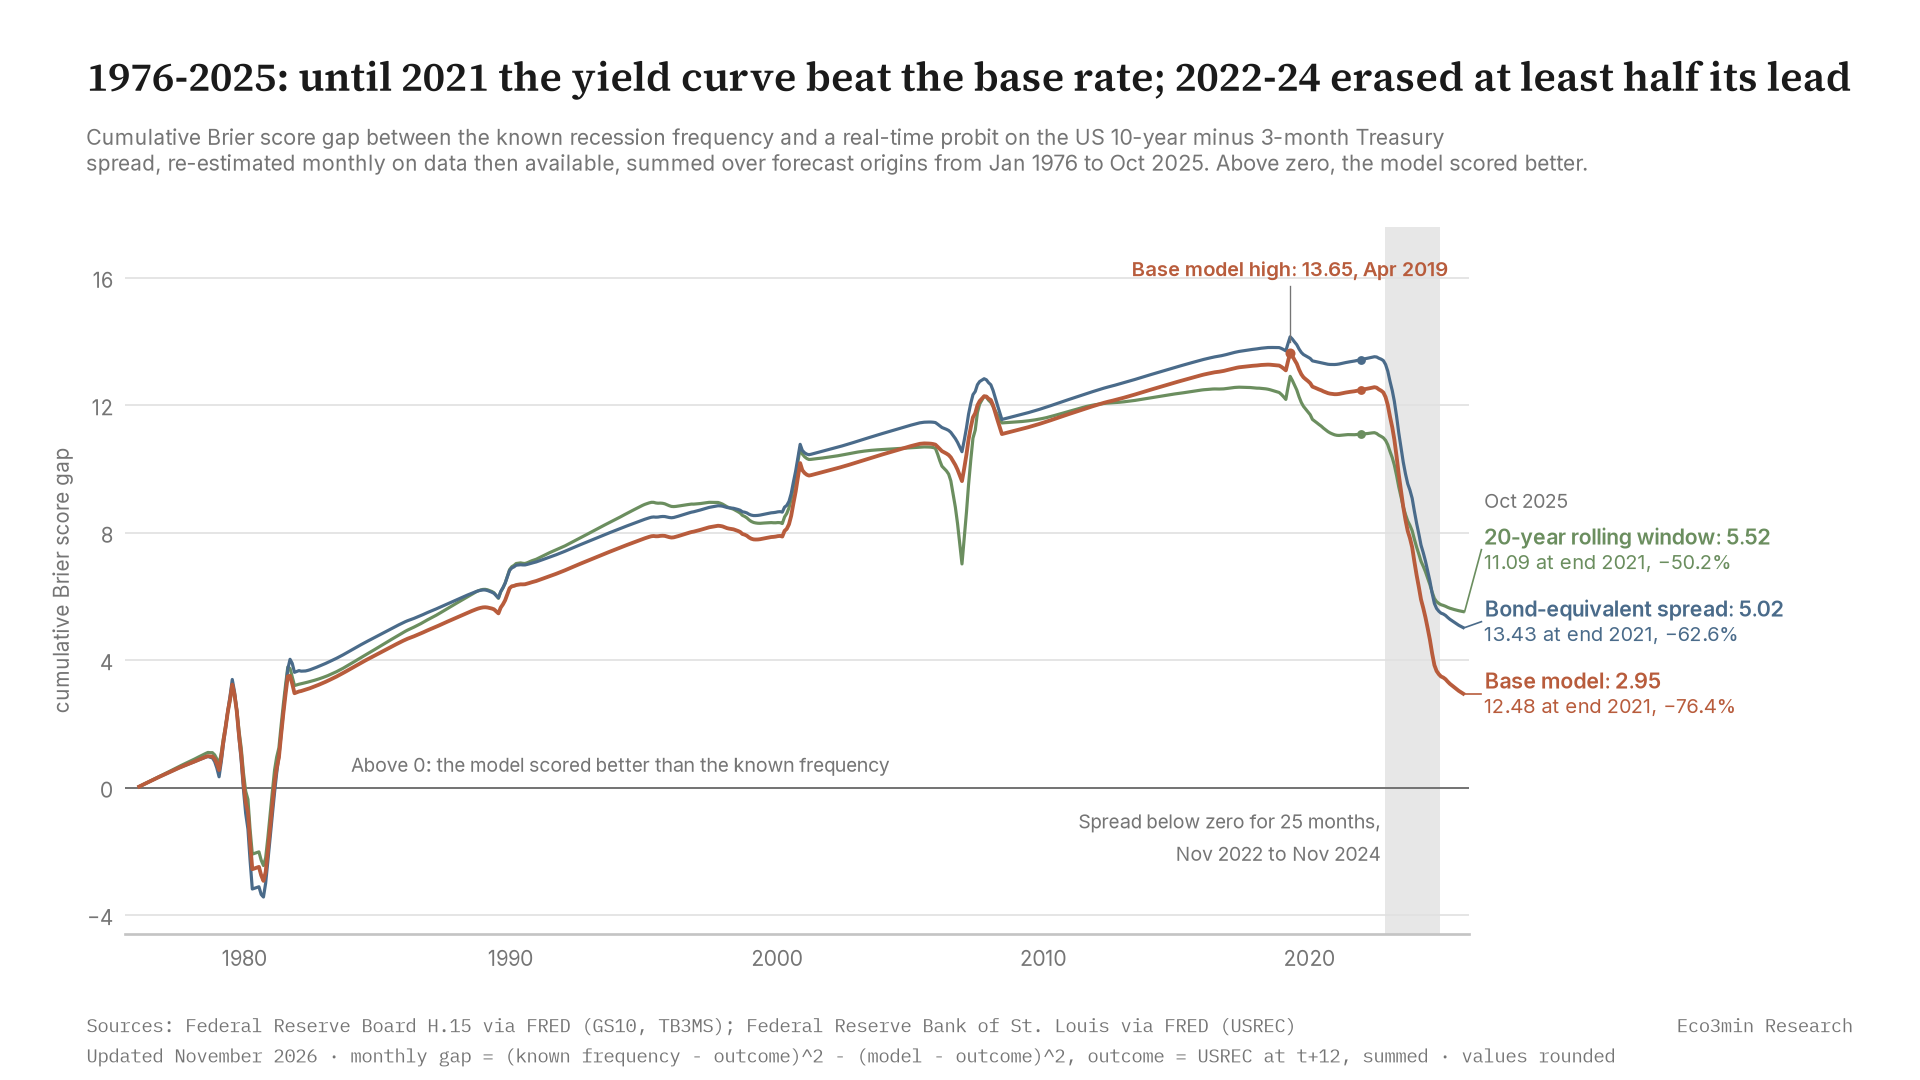
Source: FRED (GS10, TB3MS, USREC). Eco3min Research calculation on the published CSV.
Read the chart from left to right. The base model’s cumulative gap was 6.48 at the end of 1990, 9.95 at the end of 2001, 11.44 at the end of 2009 and 12.48 at the end of 2021, with its high at 13.65 in April 2019. By October 2025 it was 2.95, so 76.4% of the end-2021 edge was gone. The scoring is asymmetric. A confident reading followed by no recession costs more squared error than a calm month earns, so a few months above 0.5 undid years of accumulated edge.
The mechanism is the depth, and the depth came from the short end. Between November 2020 and May 2023 the 3-month bill rose 5.05 points and the 10-year yield 2.70 points, so the spread fell 2.35 points to its trough. In the three inversions before it, the long yield moved little or fell: −0.10 point before the 2000 trough, +0.28 before 2007 and −0.56 before 2019. A probit sees only the difference, so it read the 2023 trough like the troughs of 1979 to 1981 it had been fitted on. The transmission from an inversion to a recession, through bank lending margins and credit supply, is set out in the credit-channel analysis, and the model observes none of it.
Takeaway
The 2022-24 cycle left the sign of the edge intact: in all five variants the cumulative gap stays positive in October 2025. It cut that gap by 50.2% to 77.1% and brought the full-sample score down to +0.054, inside a 90% interval that includes zero.
The case for a late signal
The strongest reply to this record is that the recession is late, and that one episode settles little. Both points have support in the data. The sample holds 6 evaluated recessions and 58 recession target months, and the full-sample interval runs from −0.326 to +0.308, so a score of zero and a score of +0.3 are both consistent with what has been observed. The argument that a slow signal keeps its value, made in why a slow regime signal still works, fits that width.
Two tests separate what the data can and cannot say. The Diebold-Mariano test asks whether the model’s squared errors are smaller than the base rate’s on average. Over the full evaluation it does not reject equality (t 0.31, p 0.378). The Clark-West test asks a narrower question, suited to nested models: does adding the spread to a constant-probability model carry information, once the noise of estimating the extra coefficient is allowed for? It does, with t 2.90 and p 0.002. The spread carries information beyond the base rate, while the gain in accuracy over the full window is not statistically distinguishable from zero.
The robustness checks, in full. Shortening the information lag to 6 months or lengthening it to 18 moves the score by −0.003 and −0.002 (paired 90% intervals −0.013 to +0.009 and −0.007 to +0.002). Measuring the bill on a bond-equivalent basis, the New York Fed convention, raises it by +0.038 (+0.000 to +0.095). A 20-year rolling window raises it by +0.046 (−0.056 to +0.183) and erases the least of the edge, 50.2%. A control at a 24-month lag, outside the published variants, gives +0.049 and a 2022-24 peak of 0.769 (May 2023, −1.57 pt). Across the five published variants, the share of the end-2021 edge erased by October 2025 runs from 50.2% (20-year rolling window) to 77.1% (6-month lag).
| Variant | Full-sample BSS | 90% interval | P(BSS ≤ 0) | DM t (p) | CW t (p) | Edge, end-2021 | Edge, Oct 2025 | Share erased | Peak, May 2023 (spread −1.57 pt) |
|---|---|---|---|---|---|---|---|---|---|
| 12-month lag, base (lag12) | +0.054 | −0.326 to +0.308 | 0.347 | +0.31 (0.378) | +2.90 (0.002) | 12.48 | 2.95 | 76.4% | 0.766 |
| 6-month lag (lag6) | +0.050 | −0.324 to +0.300 | 0.351 | +0.30 (0.384) | +3.00 (0.001) | 12.07 | 2.76 | 77.1% | 0.767 |
| 18-month lag (lag18) | +0.052 | −0.328 to +0.308 | 0.349 | +0.30 (0.382) | +2.88 (0.002) | 12.48 | 2.86 | 77.1% | 0.766 |
| Bond-equivalent spread (bond_equiv) | +0.092 | −0.261 to +0.346 | 0.277 | +0.52 (0.303) | +2.74 (0.003) | 13.43 | 5.02 | 62.6% | 0.731 |
| 20-year rolling window (roll240) | +0.100 | −0.177 to +0.298 | 0.230 | +0.65 (0.257) | +2.95 (0.002) | 11.09 | 5.52 | 50.2% | 0.604 |
All five variants are scored on the same 598 origins and 6 recessions. The rolling window estimates each month on the previous 240 pairs only, so by 2023 its sample no longer includes the inversions of 1979 to 1981, and its 2023 peak is 0.604.
Three objections from the other side deserve their full weight. The first is the term premium. A 10-year yield held down by central-bank bond holdings can invert the curve without the usual message about expected rate cuts, and a two-series model cannot tell the two cases apart. The second is the short leg: the 2022-24 inversion rested on a 5.05-point rise in the 3-month bill, and a policy shock of that size may act on a longer lag than past cycles did. The third is precedent. The curve inverted from September 1966 to January 1967, with a trough of −0.34 pt in October 1966, and USREC shows no recession start within 36 months; that episode sits outside the evaluation window, which starts with 1976 origins.
Takeaway
The evidence cuts both ways. Ex ante skill before 2022 is measurable and the spread still carries information (Clark-West p 0.002), yet over the full evaluation the model cannot be told apart from the base rate, with 6 recessions behind each number.
When will we know?
USREC is provisional at its end. It follows the NBER business-cycle dates, which are announced after the fact, so a peak dated later in 2025 or 2026 would turn recent zeros into ones. Two rules in this study take that into account. An episode is judged only once 36 months have passed since its onset and USREC covers that month. Until then it is pending, and it is never counted as an episode without a recession. A provisional cut also drops origins whose target falls in the last 18 USREC months, and on that cut the base model’s score is +0.103 (580 origins).
On those rules, the 30% episode that began in November 2022 is judged a false positive, because USREC covers its 36-month horizon of November 2025. The 50% episode that began in November 2023 (0.555 at −0.77 pt) is pending. Its 36-month horizon ends in November 2026, and it becomes judgeable once USREC covers that month.
History offers a second clock. In the inversions followed by a recession, the first recession month came 4 months after the last month of inversion in 2001, 9 months after it in 2008 and 6 months after it in 2020. In 1980 and 1981 it came 2 months before and in the same month. The 2022-24 run ended in November 2024. By October 2026, 23 months had passed with no USREC recession month, longer than any de-inversion lag in the table since 1953, where the longest is 9 months.
Neither clock is a forecast. They define when the 2022-24 record can be closed in the data, and as of November 2026 it cannot.
Slide the threshold, 1976 to 2026
The module below draws the base model’s probability since January 1976 over the USREC bands, with the known recession frequency for comparison and the spread in the tooltip. Move the threshold between 25% and 55% to see which episodes would have been flagged, and when. For the shape of the whole curve on any date, see the US Treasury yield curve through time.
The module reads the published CSV directly. If it does not load, the chart shown in its place is the static version of the default view.
What each threshold crossing was followed by
No market returns here. The study measures an indicator, so the outcome after each crossing is a recession start or its absence. An episode is a run of consecutive months at or above the threshold. It counts as a true positive if a recession starts within 24 months of its onset, and as a false positive if none starts within 36 months and USREC covers that horizon. Starts between 24 and 36 months stay unclassified, and episodes whose horizon USREC does not yet cover are pending.
| Threshold | Onset | Probability at onset | Spread at onset (pt) | Outcome | Recession start | Lead (months) |
|---|---|---|---|---|---|---|
| 30% | 1978-11 | 0.322 | +0.17 | true positive | 1980-02 | 15 |
| 30% | 1980-10 | 0.335 | +0.13 | true positive | 1981-08 | 10 |
| 30% | 1989-06 | 0.304 | +0.13 | true positive | 1990-08 | 14 |
| 30% | 2000-07 | 0.313 | +0.09 | true positive | 2001-04 | 9 |
| 30% | 2006-02 | 0.306 | +0.14 | true positive | 2008-01 | 23 |
| 30% | 2006-07 | 0.306 | +0.14 | true positive | 2008-01 | 18 |
| 30% | 2019-03 | 0.309 | +0.17 | true positive | 2020-03, exogenous shock | 12 |
| 30% | 2020-02 | 0.359 | −0.02 | true positive | 2020-03, exogenous shock | 1 |
| 30% | 2022-11 | 0.406 | −0.26 | false positive | none | none |
| 50% | 1979-03 | 0.530 | −0.36 | true positive | 1980-02 | 11 |
| 50% | 1979-05 | 0.530 | −0.36 | true positive | 1980-02 | 9 |
| 50% | 1979-07 | 0.502 | −0.29 | true positive | 1980-02 | 7 |
| 50% | 1980-11 | 0.785 | −1.05 | true positive | 1981-08 | 9 |
| 50% | 1981-05 | 0.982 | −2.20 | true positive | 1981-08 | 3 |
| 50% | 2022-12 | 0.513 | −0.63 | false positive | none | none |
| 50% | 2023-11 | 0.555 | −0.77 | pending | none yet | none |
At 30%, the base model flagged all 6 evaluated recessions with 8 true positives and 1 false positive, 2022-11. The median lead was 13.0 months, from 9 to 23. At 50% it flagged 2 of 6, in 1980 and 1981, with 5 true positives, 1 false positive (2022-12) and 1 pending episode (2023-11). Most 30% crossings before 2022 came while the spread was still positive, between +0.09 and +0.17 pt, whereas the 2022-11 crossing came at −0.26 pt.
Across variants, all five flag 6 of 6 recessions at 30%. At 50%, four of them flag 2 of 6, and the 20-year rolling window flags 3 of 6 by adding 2008.
Detections and false positives by threshold, 25% to 55%
Base model, evaluation origins from 1976. False positives are counted only when judgeable under the 36-month rule.
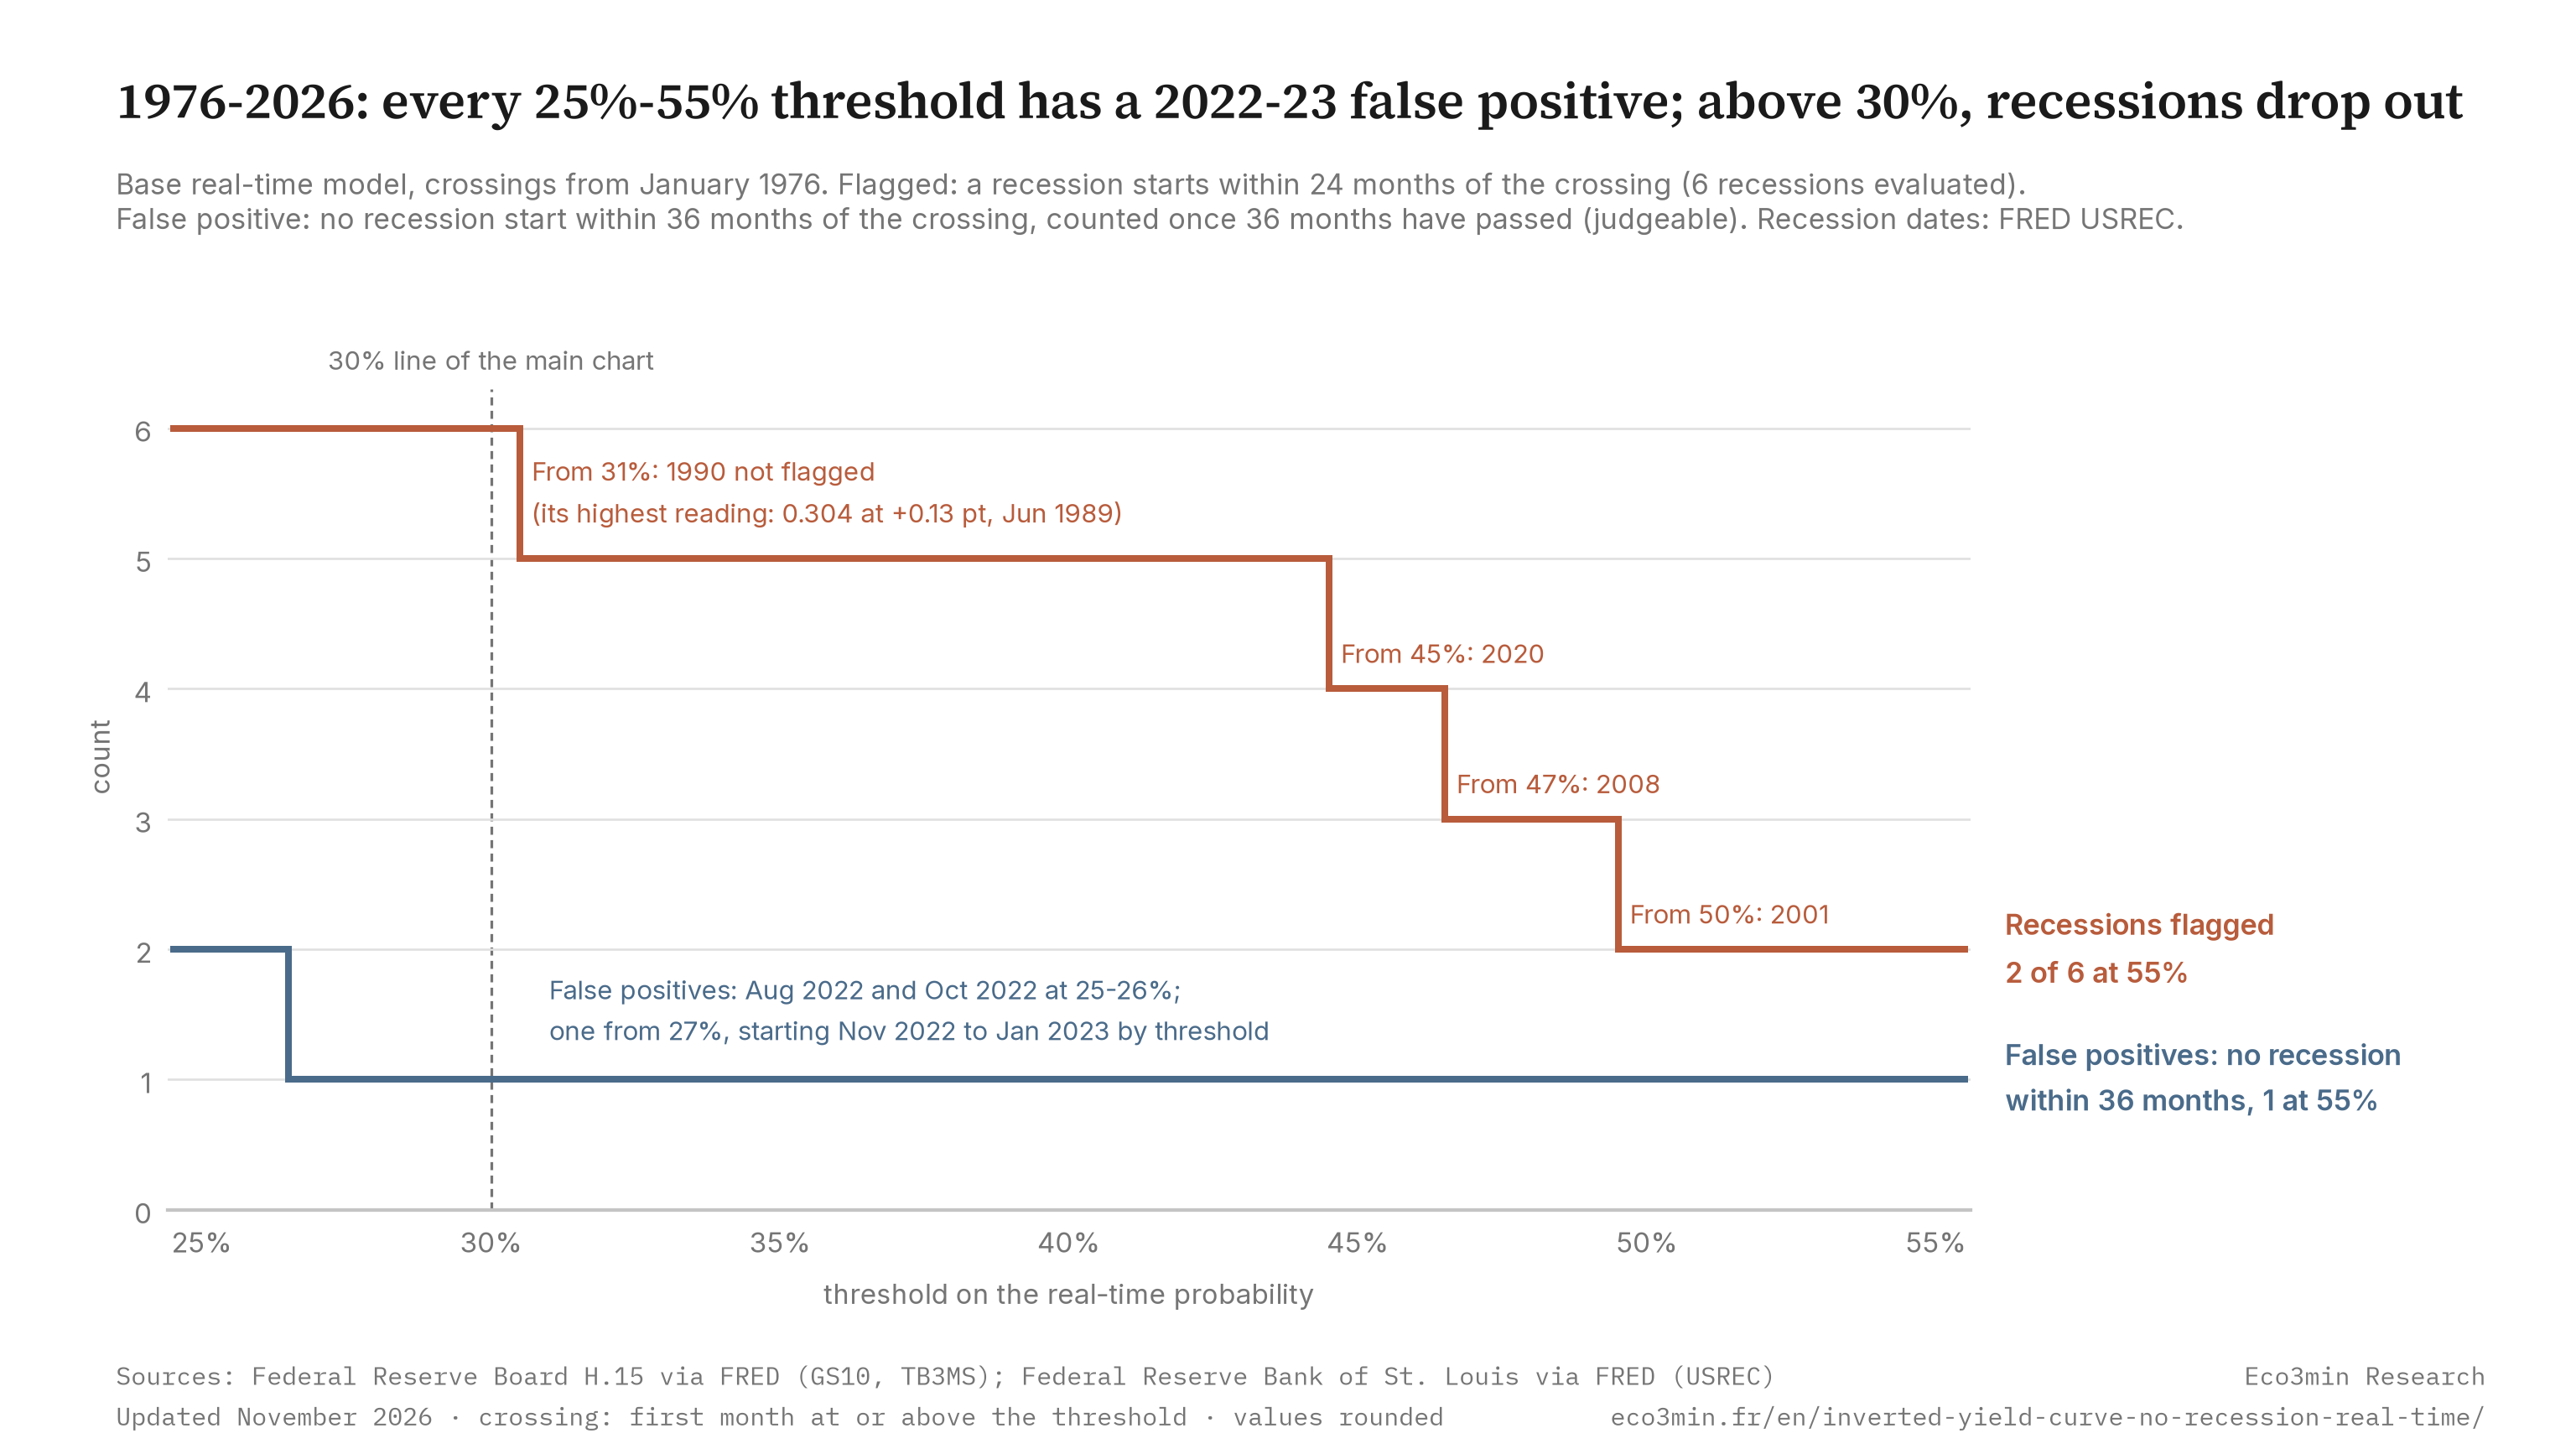
Source: FRED (GS10, TB3MS, USREC). Eco3min Research calculation on the published CSV.
The 30% line is a convention, and the sweep shows how much rides on it. From 25% to 30% all 6 recessions are flagged. From 31% the 1990 recession drops out, its peak reading having been 0.304 at +0.13 pt, then 2020 from 45%, 2008 from 47% and 2001 from 50%. Judgeable false positives number 2 at 25% and 26%, and 1 from 27% to 55%. Below 30%, some crossings fall 24 to 36 months before a recession and stay unclassified, 2 from 25% to 27% and 1 at 28% and 29%.
Past distributions are not predictive of future outcomes. Here the distribution is one of episode outcomes, built on 6 evaluated recessions, so one more episode can move every share in the table, and episodes at the same threshold overlap in time.
Takeaway
At 30% the record before 2022 has no miss and no false alarm. At 50% it caught only the two recessions of 1980 and 1981, and its first episode without a recession, 2022-12, came in the 2022-24 cycle.
Levels to watch
Three markers, descriptive only, read from the October 2026 estimate. The coefficients are re-estimated each month, so the spread levels move with them.
Invalidation threshold
If the monthly spread falls from +1.08 pt to −0.17 pt or below, then the October 2026 estimate would show 30% instead of 0.103, historically associated with a crossing before each of the 6 evaluated recessions and a median lead of 13.0 months. The one judgeable false positive at 30% is 2022-11.Confirmation signal
If the spread reaches −1.06 pt, then the same estimate would show 50%, historically associated with a recession start 3 to 11 months later for the five 50% episodes that began between March 1979 and May 1981, and with 1 false positive (2022-12) and 1 pending episode (2023-11) since.Calendar catalyst
If USREC extends through November 2026 without a recession month, then the 50% episode that began in November 2023 (0.555 at −0.77 pt) moves from pending to false positive, historically associated with the 2022-12 episode. That episode, judged under the 36-month rule once USREC covered December 2025, was the first 50% episode without a recession in the evaluation.
Peak and decomposition tables
Two tables carry the episode detail behind the charts. The first gives the highest reading in the 24 months before each recession start, and the maxima over 36 months are the same. The second splits each inversion of 2 months or more into its long and short legs, from 24 months before the onset to the trough, and gives the lag from the last negative month to the recession start.
| Episode (recession start) | Peak probability, 24 months before | Month of peak | Spread at peak (pt) | Rank of 7 |
|---|---|---|---|---|
| 1980-02 | 0.920 | 1979-12 | −1.65 | 2 |
| 1981-08 | 0.992 | 1980-12 | −2.65 | 1 |
| 1990-08 | 0.304 | 1989-06 | +0.13 | 7 |
| 2001-04 | 0.492 | 2000-12 | −0.53 | 4 |
| 2008-01 | 0.467 | 2007-03 | −0.38 | 5 |
| 2020-03, exogenous shock | 0.446 | 2019-08 | −0.32 | 6 |
| 2022-24 window, no recession as of November 2026 | 0.766 | 2023-05 | −1.57 | 3 |
| Inversion run | Outcome (2-month rule) | Window | ΔGS10 (pt) | ΔTB3MS (pt) | Δspread (pt) | Last negative month to recession (months) |
|---|---|---|---|---|---|---|
| 1966-09 to 1967-01 | false positive | 1964-09 to 1966-10 | +0.81 | +1.82 | −1.01 | none |
| 1969-07 to 1969-08 | true positive, 1970-01 | 1967-07 to 1969-08 | +1.53 | +2.77 | −1.24 | +5 |
| 1969-11 to 1970-01 | true positive, 1970-01 | 1967-11 to 1969-12 | +1.90 | +3.09 | −1.19 | +0 |
| 1973-06 to 1974-06 | true positive, 1973-12 | 1971-06 to 1973-08 | +0.88 | +3.92 | −3.04 | −6 |
| 1974-08 to 1974-09 | during recession | 1972-08 to 1974-08 | +1.83 | +4.94 | −3.11 | none |
| 1978-12 to 1980-04 | true positive, 1980-02 | 1976-12 to 1980-03 | +5.88 | +10.85 | −4.97 | −2 |
| 1980-11 to 1981-08 | true positive, 1981-08 | 1978-11 to 1980-12 | +4.03 | +6.85 | −2.82 | +0 |
| 2000-08 to 2000-12 | true positive, 2001-04 | 1998-08 to 2000-12 | −0.10 | +0.87 | −0.97 | +4 |
| 2006-08 to 2007-04 | true positive, 2008-01 | 2004-08 to 2007-03 | +0.28 | +3.46 | −3.18 | +9 |
| 2019-06 to 2019-09 | true positive, 2020-03 (exogenous shock) | 2017-06 to 2019-08 | −0.56 | +0.97 | −1.53 | +6 |
| 2022-11 to 2024-11 | false positive | 2020-11 to 2023-05 | +2.70 | +5.05 | −2.35 | none |
A negative lag means the recession began before the curve turned positive again. The 2020-03 recession is labelled an exogenous shock, the pandemic, and counted by protocol.
Historical turning points
Since April 1953 the spread has inverted in 13 runs, 11 of them lasting 2 months or more. The 2022-24 run ranks 1 of 13 on duration (25 months) and 3 on depth (−1.57 pt), behind 1980-81 (−2.65 pt) and 1978-80 (−2.45 pt). The 2s10s view of inversion history is in the yield-curve inversion history, and the dated record in the yield-curve inversion history dataset.
| Inversion run | Months | Trough (pt) | Trough month | Duration rank | Depth rank |
|---|---|---|---|---|---|
| 1966-09 to 1967-01 | 5 | −0.34 | 1966-10 | 6 | 8 |
| 1969-07 to 1969-08 | 2 | −0.29 | 1969-08 | 10 | 10 |
| 1969-11 to 1970-01 | 3 | −0.17 | 1969-12 | 9 | 11 |
| 1973-06 to 1974-06 | 13 | −1.27 | 1973-08 | 3 | 4 |
| 1974-08 to 1974-09 | 2 | −0.92 | 1974-08 | 10 | 5 |
| 1978-12 to 1980-04 | 17 | −2.45 | 1980-03 | 2 | 2 |
| 1980-11 to 1981-08 | 10 | −2.65 | 1980-12 | 4 | 1 |
| 2000-08 to 2000-12 | 5 | −0.53 | 2000-12 | 6 | 6 |
| 2006-08 to 2007-04 | 9 | −0.38 | 2007-03 | 5 | 7 |
| 2019-06 to 2019-09 | 4 | −0.32 | 2019-08 | 8 | 9 |
| 2022-11 to 2024-11 | 25 | −1.57 | 2023-05 | 1 | 3 |
Runs of 2 months or more. Ranks are computed on all 13 runs, one-month runs included.
October 1966: inversion, no recession
The 1966-67 run lasted 5 months and bottomed at −0.34 pt in October 1966. USREC shows no recession start within the next 36 months, so the 2-month rule scores it a false positive. It sits before the evaluation window, which scores no forecast origin before January 1976.
December 1980: the deepest trough
The spread reached −2.65 pt in December 1980, and the model would have shown 0.992, the highest pre-recession reading of the 7 episodes. The recession started in August 1981, the same month the run ended.
February 2006: the longest lead
The base model crossed 30% in February 2006 at +0.14 pt, before the curve inverted in August 2006. The recession started in January 2008, 23 months later and 9 months after the last negative month.
August 2019: an exogenous shock
The 2019 run peaked at 0.446 at −0.32 pt in August 2019. The recession that started in March 2020 is an exogenous shock, the pandemic. The study counts it by protocol and reports the score without 2018-2020 origins, +0.073, alongside.
May 2023: the deepest since 1981
At −1.57 pt the 2023 trough was the lowest spread since May 1981 (−2.20 pt), and the model would have shown 0.766. The peaks ahead of the 1981 and 1980 recessions stood higher, at 0.992 in December 1980 (−2.65 pt) and 0.920 in December 1979 (−1.65 pt).
October 2026: the current observation
The spread stood at +1.08 pt and the base model at 0.103, below the known recession frequency of 0.122. The last negative month was November 2024, and the last USREC recession month April 2020.Methodology
Every probability in this study is a reconstruction: what a model re-estimated monthly on data then available would have shown, computed in November 2026. None of these readings was published at the time. “Real-time” refers to the estimation, which at each month uses only past spreads and recession dates lagged 12 months, a stand-in for when they became known. It does not refer to the choice of model, a probit on the 10-year/3-month spread published by Estrella and Hardouvelis in 1989-1991, first as a New York Fed research paper in May 1989.
Model
P(USREC at t+12 = 1 | spread at t) = Φ(a_t + b_t × spread_t), with spread_t = GS10_t − TB3MS_t
a_t and b_t are estimated on the pairs (spread_s, USREC_s+12) with s + 12 ≤ t − L, from April 1953 (expanding window) or over the last 240 months (rolling window)
L = 12 in the base model, 6 and 18 in the variants, 24 in a control kept outside the published file
Bond-equivalent variant: TB3MS_be = 100 × 365 × d / (360 − 91 × d), with d = TB3MS / 100
Scores
Benchmark base_t: share of recession months among the targets known at t
Brier skill score: BSS = 1 − mean((p − y)²) / mean((base − y)²), with y = USREC at t+12
Pseudo-R²: 1 − log-likelihood(model) / log-likelihood(base), on the same origins
Cumulative ΔBrier at T: sum over origins t ≤ T of (base_t − y)² − (p_t − y)², above zero when the model is ahead
Inference uses a circular block bootstrap with 24-month blocks, 2,000 draws and a fixed seed (20261022), for 90% intervals on the BSS, the pseudo-R² and the AUC. In the full sample, 1 draw contained no recession. The Diebold-Mariano test uses a HAC variance with 12 lags. The Clark-West test compares the spread model with the nested base-rate model. Both are one-sided.
Episodes follow a fixed algorithm. A run of consecutive months at or above the threshold is an episode, with its onset at the first month. The lead to a recession is measured from the onset of the first episode classified as a true positive for that recession. Pre-recession maxima are taken over 24 and 36 months, and the inversion decomposition runs from 24 months before the onset to the trough month.
Sensitivity covers the information lag (6 and 18 months), the rate convention (bond-equivalent), the estimation window (240 months), thresholds from 25% to 55% in steps of 1 point, maxima over 24 and 36 months, the sample without 2018-2020 origins, the provisional cut and the 24-month control. The cumulative edge stays positive in all five published variants, and the share of its end-2021 level erased by October 2025 runs from 50.2% (roll240) to 77.1% (lag6), with lag12 at 76.4%, lag18 at 77.1% (just below lag6 before rounding) and bond_equiv at 62.6%.
Recession periods follow the FRED series USREC, the Federal Reserve Bank of St. Louis reading of NBER business-cycle dates, where a month counts as recession from the period following the peak through the trough. No NBER date is used directly, and the NBER announcement delay is replaced by fixed lags of 6, 12 and 18 months. The probit on this spread goes back to Estrella and Hardouvelis (1991) and Estrella and Mishkin (1998). Estrella, Rodrigues and Schich (2003) tested its stability, and the forecast comparisons use Diebold and Mariano (1995) and Clark and West (2007).
Filter definitions
- evaluation (1976-01 to 2025-10): forecast origins whose 12-month-ahead USREC target is in the CSV
- 1976-1990 (1976-01 to 1990-12): before the probit on this spread was published (1989-1991)
- 1991-2021 (1991-01 to 2021-12): after publication, before the 2022-24 inversion
- 1991-latest (1991-01 to 2025-10): all origins since 1991
- 1976-2021 (1976-01 to 2021-12): all origins before the 2022-24 inversion, used for the end-2021 edge
- ex-2018-2020 (2018-01 to 2020-12): origins removed, targets in the 2019-2021 Covid window
- provisional cut (1976-01 to 2024-04): origins whose target is no later than 2025-04, the last 18 USREC months treated as provisional
- pre-recession window 24: months R−24 to R−1 before R, the first month with USREC = 1
- pre-recession window 36: months R−36 to R−1
- 2022-24 window (2022-01 to 2024-12): the 2022-24 inversion cycle
- pre-2022 onsets (onset before 2022-01): threshold episodes that began before the 2022-24 window
- replication (1990-2024, origins 1990-01 to 2023-12): in-sample probit reproducing page 14063, 408 monthly origins whose targets run through 2024-12, and the 2-month inversion rule on runs starting 1990-01 to 2024-12
- full history (1953-04 to 2026-10): the 883 rows of the CSV, used for inversion runs and their ranks
Episode rules
- episode: run of consecutive months with probability at or above the threshold, onset at the first month of the run
- true positive: first recession start R after the onset with R no later than onset + 24 months
- early (24-36): first recession start R with onset + 24 < R ≤ onset + 36, left unclassified
- false positive: no recession start within onset + 36 months, and onset + 36 no later than the last USREC month (judgeable)
- pending: no recession start yet, onset + 36 later than the last USREC month
- during recession: the onset month has USREC = 1
- inversion run: consecutive months with spread_10y3m < 0; inversion rule: a run of 2 months or more, onset at the first negative month
- decomposition: change from 24 months before the inversion onset to the run’s trough month
- de-inversion lag: months from the last negative month of the run to R
| Column | Unit | Source | Definition |
|---|---|---|---|
| date | YYYY-MM | FRED | month of observation |
| gs10 | % | FRED GS10 (Federal Reserve Board H.15) | 10-year Treasury constant maturity, monthly average |
| tb3ms | % | FRED TB3MS (Federal Reserve Board H.15) | 3-month Treasury bill, secondary market, discount basis, monthly average |
| tb3ms_bond_equiv | % | Eco3min calculation | TB3MS on a bond-equivalent basis, 91-day bill |
| spread_10y3m | pt | Eco3min calculation | gs10 − tb3ms |
| spread_10y3m_bond_equiv | pt | Eco3min calculation | gs10 − tb3ms_bond_equiv |
| usrec | 0/1 | FRED USREC (St. Louis Fed, from NBER dates) | 1 = recession month |
| inverted_run_months | months | Eco3min calculation | consecutive months with spread_10y3m < 0, up to this month |
| prob_rt_lag12, base_rt_lag12 | 0 to 1 | Eco3min model | real-time probability and known recession frequency, 12-month information lag |
| coef_const_lag12, coef_spread_lag12 | none, per pt | Eco3min model | probit intercept and slope estimated at t |
| prob_rt_lag6, base_rt_lag6 | 0 to 1 | Eco3min model | same with a 6-month information lag |
| prob_rt_lag18, base_rt_lag18 | 0 to 1 | Eco3min model | same with an 18-month information lag |
| prob_rt_bond_equiv | 0 to 1 | Eco3min model | as prob_rt_lag12 on the bond-equivalent spread, benchmark base_rt_lag12 |
| prob_rt_roll240, base_rt_roll240 | 0 to 1 | Eco3min model | rolling 240-month window and its known recession frequency |
| usrec_t6, usrec_t12 | 0/1 | FRED USREC, shifted | usrec 6 and 12 months later, empty until observed; usrec_t12 is the model target |
The model columns are empty before January 1976 by construction. The code below rebuilds prob_rt_lag12 from the CSV, with a maximum gap of 5.00e-07 against the published column.
Reproduce the base model in Python
import numpy as np, pandas as pd, statsmodels.api as sm
from scipy.stats import norm
df = pd.read_csv("r23-real-time-yield-curve-recession-probability-1953-2026-v2.csv")
x, y, L = df["spread_10y3m"].values, df["usrec_t12"].values, 12
p = np.full(len(df), np.nan)
for i in df.index[df["date"] >= "1976-01"]:
    k = i - 12 - L                      # last origin s with s + 12 <= t - L
    m = sm.Probit(y[:k + 1], sm.add_constant(x[:k + 1])).fit(disp=0)
    p[i] = norm.cdf(m.params[0] + m.params[1] * x[i])
print(np.nanmax(np.abs(p - df["prob_rt_lag12"].values)))Sources and references
- Board of Governors of the Federal Reserve System (US), Market Yield on U.S. Treasury Securities at 10-Year Constant Maturity, Quoted on an Investment Basis [GS10], retrieved from FRED, Federal Reserve Bank of St. Louis; fred.stlouisfed.org/series/GS10, November 3, 2026. Public domain, citation requested.
- Board of Governors of the Federal Reserve System (US), 3-Month Treasury Bill Secondary Market Rate, Discount Basis [TB3MS], retrieved from FRED, Federal Reserve Bank of St. Louis; fred.stlouisfed.org/series/TB3MS, November 3, 2026. Public domain, citation requested.
- Federal Reserve Bank of St. Louis, NBER based Recession Indicators for the United States from the Period following the Peak through the Trough [USREC], retrieved from FRED, Federal Reserve Bank of St. Louis; fred.stlouisfed.org/series/USREC, November 3, 2026. Copyrighted, citation required.
- Estrella, Arturo, and Gikas Hardouvelis (1991). “The Term Structure as a Predictor of Real Economic Activity.” Journal of Finance 46, 555–576. First circulated as a Federal Reserve Bank of New York research paper, May 1989.
- Estrella, Arturo, and Frederic S. Mishkin (1998). “Predicting U.S. Recessions: Financial Variables as Leading Indicators.” Review of Economics and Statistics 80, 45–61.
- Estrella, Arturo, Anthony P. Rodrigues and Sebastian Schich (2003). “How Stable Is the Predictive Power of the Yield Curve? Evidence from Germany and the United States.” Review of Economics and Statistics 85, 629–644.
- Diebold, Francis X., and Roberto S. Mariano (1995). “Comparing Predictive Accuracy.” Journal of Business & Economic Statistics 13(3), 253–263.
- Clark, Todd E., and Kenneth D. West (2007). “Approximately Normal Tests for Equal Predictive Accuracy in Nested Models.” Journal of Econometrics 138(1), 291–311.
Limitations
- Revisions. USREC follows NBER dates announced after the fact, so its last months are provisional. The provisional cut, which drops the last 18 months of targets, gives a base score of +0.103 instead of +0.054.
- Information lag. A fixed 12-month lag stands in for the date each recession became known. It approximates the announcement calendar without reproducing it, and the 6- and 18-month variants test that choice.
- Composition. Two yields and one binary flag. The model sees neither the term premium nor credit conditions, and a 10-year/2-year spread gives other dates, as the T10Y3M and T10Y2Y comparison shows.
- Non-stationarity. The link between the spread and recessions can shift with the monetary regime, the question Estrella, Rodrigues and Schich (2003) put to the US and German data. The 20-year rolling window is the variant built for that case, and it erases 50.2% of the edge.
- Overlapping windows. Monthly origins with 12-month targets overlap, so 598 origins hold 6 recessions and 58 recession target months. The 24-month block bootstrap and the HAC variance allow for that dependence, and they widen the intervals.
- Ex post against ex ante. The specification was published in 1989-1991. The 1976-1990 segment uses a model chosen with hindsight, which is why the 1991-2021 segment is reported beside it.
- Start date and scope. Scores begin with January 1976 origins, and every reading is a reconstruction made in November 2026. Market behaviour is outside the study, covered in why markets rose despite an inverted yield curve.
Frequently asked questions
Why was there no recession after the 2022 yield curve inversion?
Has the yield curve inverted without a recession before?
Yes. On the monthly 10-year/3-month spread since 1953, the run from September 1966 to January 1967 (trough −0.34 pt) was not followed by a recession start within 36 months. Under the same 2-month rule, the 2022-24 run is the second such case as of November 2026. The other runs of 2 months or more were followed by a recession, or began during one, in 1974.
What does the yield-curve recession model show now?
Did the 2022-24 inversion disprove the yield-curve recession signal?
One episode settles little, and the data cut both ways. Before 2022 the model beat the base rate out of sample, with +0.212 from 1991 to 2021 and an interval above zero. Over the full evaluation, with 6 recessions, its score of +0.054 is not statistically distinguishable from the base rate, while the Clark-West test (p 0.002) still finds information in the spread. The 2022-24 cycle erased 50.2% to 77.1% of the cumulative edge, depending on the variant, and the 50% episode of November 2023 is pending until USREC covers November 2026.
Does a 50% yield-curve reading mean a recession within 12 months?
The model gives the probability of being in recession in the month 12 months ahead. It does not give the probability of a recession starting at some point within 12 months. In the evaluation, readings of 0.5 or more were followed by a recession month 12 months later in 0.268 of cases (41 origins), against an average reading of 0.707. At the 50% threshold, 2 of the 6 evaluated recessions were flagged.
Can I reuse the monthly file?
Yes, under FRED’s terms. USREC is copyrighted and requires a citation, so the file carries FRED’s terms with that citation and is never released under CC BY, including the columns Eco3min computes from it. GS10 and TB3MS come from Federal Reserve Board H.15 and are in the public domain. Eco3min text and analysis are under CC BY 4.0, cited as shown below.
Cite this page
Eco3min Research (2026). Inverted Yield Curve, No Recession: What a Real-Time Model Showed, 1976-2026. https://eco3min.fr/en/inverted-yield-curve-no-recession-real-time/
Last updated — 3 November 2026
Disclaimer – Financial and Legal Information: The analyses, commentary, and content published on eco3min.fr are provided for informational and educational purposes only. They do not constitute investment advice or a solicitation to buy or sell financial instruments. Past performance is not indicative of future results. All investment decisions involve risk and are the sole responsibility of the reader. Data, charts and calculated series are provided as is and may contain errors or lag behind their source: check any figure against the primary source cited before relying on it. Content describing laws, regulations or contracts reflects the law as of its publication date and does not constitute legal or tax advice; applying it to a specific situation requires a qualified legal or tax professional.