
Dollar and 12 peers: 79%+ of purchasing power destroyed in just three episodes
TL;DR
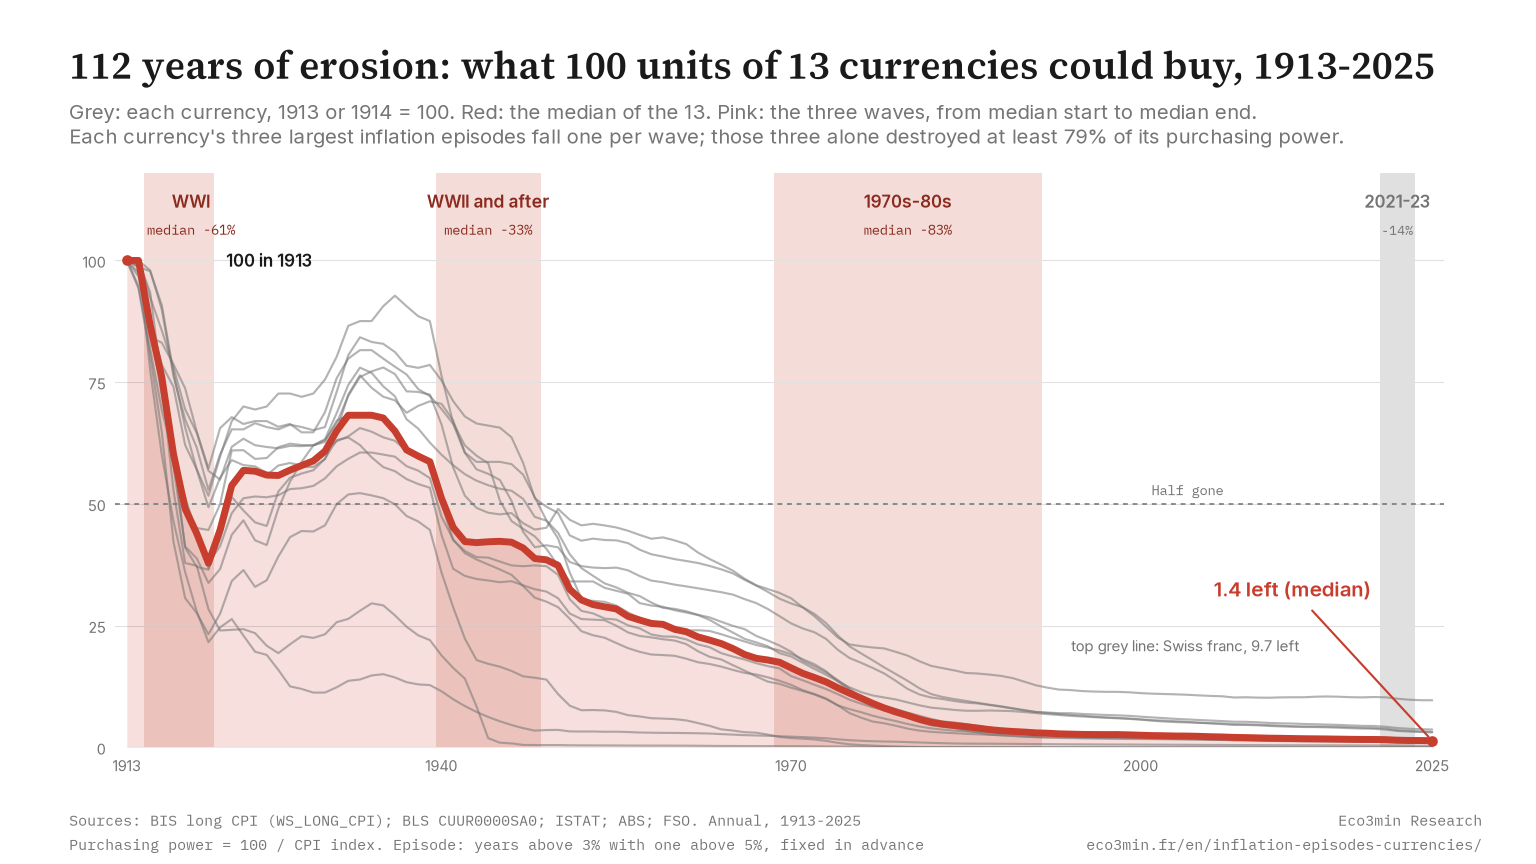
In 13 currencies with prices back to 1913 or 1914, each currency’s three largest inflation episodes alone destroyed at least 79% of its purchasing power, 88% for the dollar.
- The same three waves in every currency, with a median loss of 61% in the First World War, 33% in the Second World War or just after it, and 83% in a long 1970s.
- Those three episodes hold 62% to 86% of the rise in log prices, in a median 29% of the years. Shuffle the order of the years 10,000 times and they hold a median 27%: the real order beats every shuffle, in every currency.
- 2021 to 2023 cost a median 14% of purchasing power, and that episode is not among the three largest in any of the 13.
A breakdown of US inflation since 1913, posted here in March, showed that most of the rise in American consumer prices came in four episodes. The first question in the replies was the right one: is that a fact about the dollar, or about inflation?
It is not about the dollar. The same test, with one rule fixed before any non-US series was loaded, gives the same shape in all 13 currencies whose consumer price index reaches back to 1913 or 1914. Counting only the price rise inside each currency’s three largest episodes, the smallest loss of purchasing power is the Swiss franc’s, 79.6%. The dollar lost 88.3%, the median currency 95.8%, the Icelandic krona 99.99%.
In the dollar’s case, prices rose ×1.98 in 1916–20, ×1.34 in 1946–48 and ×3.22 in 1968–85, so ×8.54 in all. Had those been the only price changes since 1913, 100 dollars would buy what 11.7 bought then: 88.3% gone, in 23% of the years. With every other year added back, the slow ones between episodes, 100 dollars of 1913 buy 3.07 today, a loss of 96.9%. Over the 112 years from 1913 to 2025, that erosion leaves the median currency with 1.4 of every 100 units, and the Swiss franc, the currency that kept the most, with 9.7.
The March post used a different scale. Its 72%, in four episodes under a monthly rule, was a share of the rise in the logarithm of prices, not a loss of value. On that scale, the dollar’s three largest episodes under the annual rule frozen for this study hold 62%. The two numbers describe the same index: because price rises compound, episodes holding 62% of the log rise are enough to leave 11.7 of 100. The table gives both.
The episodes are the same ones everywhere. Every currency’s top three contains one episode from the First World War, one from the Second World War or its aftermath, and one from a long 1970s that started between 1961 and 1972 and ended between 1975 and 1996. Nothing after 1996 makes any top three.
Between those runs, prices crept. Sometimes they fell: Switzerland had 24 years of falling consumer prices since 1914, the United States 13.
Every number on this page is domestic: what a currency buys at home, measured by its own consumer price index. It says nothing about exchange rates. The dollar can gain against the pound in the same years that both buy less at home, and a currency with a smaller price rise here is not a “stronger” currency in the foreign exchange sense. The table compares price histories.
Three episodes, currency by currency
“Top 3 took, of purchasing power” is 1 minus 1 divided by the product of the three episodes’ price multiples: the share of a unit’s purchasing power those episodes would have removed on their own. “Share of the rise” is the share of the increase in the logarithm of the price level between the base year and 2025 that happened inside the three largest episodes. Logs make a 10% rise count the same in 1916 and in 1975, so a currency’s early years are not drowned by its later, bigger price levels.
| Currency | Prices since base year | 100 held since base year, worth today | Top 3 took, of purchasing power | Top 3 share of the rise | Top 3 share of the years | Shuffled median | Range over 36 rule variants | Top 3 episodes |
|---|---|---|---|---|---|---|---|---|
| US dollar (1913) | ×32.6 | 3.07 | 88.3% | 62% | 23% | 25% | 52–82% | 1968–85, 1916–20, 1946–48 |
| Pound sterling (1913) | ×111 | 0.90 | 96.4% | 71% | 31% | 27% | 62–92% | 1968–92, 1915–20, 1940–43 |
| Canadian dollar (1914) | ×27.3 | 3.66 | 89.7% | 69% | 26% | 25% | 57–81% | 1972–91, 1916–20, 1946–49 |
| Australian pound, then dollar (1913) | ×76.0 | 1.32 | 94.5% | 67% | 29% | 25% | 55–75% | 1970–91, 1947–53, 1917–20 |
| Swedish krona (1913) | ×61.8 | 1.62 | 95.5% | 75% | 28% | 30% | 74–91% | 1970–91, 1915–19, 1939–42 |
| Swiss franc (1914) | ×10.3 | 9.67 | 79.6% | 68% | 14% | 33% | 67–81% | 1915–19, 1970–75, 1940–43 |
| Italian lira, then euro (1913) | ×9,012 | 0.011 | 99.95% | 84% | 39% | 39% | 84–93% | 1936–48, 1970–96, 1915–18 |
| Norwegian krone (1913) | ×73.3 | 1.36 | 95.8% | 74% | 29% | 30% | 72–86% | 1970–91, 1915–20, 1940–43 |
| Danish krone (1913) | ×72.6 | 1.38 | 96.9% | 81% | 35% | 27% | 65–83% | 1961–89, 1914–20, 1940–42 |
| Dutch guilder, then euro (1913) | ×31.4 | 3.18 | 90.9% | 70% | 29% | 26% | 53–84% | 1963–82, 1915–20, 1945–51 |
| Belgian franc, then euro (1913) | ×316 | 0.32 | 98.1% | 69% | 29% | 28% | 68–75% | 1915–20, 1940–48, 1969–85 |
| NZ pound, then dollar (1914) | ×102 | 0.98 | 96.4% | 72% | 32% | 26% | 71–81% | 1967–90, 1915–21, 1950–54 |
| Icelandic krona (1913) | ×74,951 | 0.0013 | 99.99% | 86% | 44% | 36% | 78–92% | 1961–93, 1914–20, 1939–47 |
Episodes are listed from largest to smallest contribution. “100 held since base year, worth today” is in base-year prices: 100 US dollars kept in a drawer since 1913 buy what 3.07 dollars bought in 1913.
The 13 rows follow one rule. They are the ten currencies whose BIS long series on consumer prices starts in 1914 or earlier, plus Switzerland, Australia and Italy, whose BIS series start in 1921, 1922 and 1947 and are extended back to 1913 or 1914 with official national series. No currency was added or dropped on its result.
Three major currencies have no licensable index back to 1913 and are shown from their first available year. They are kept apart because a later start removes the wars from the window, which changes what “three largest” can mean.
| Currency (from) | Prices since base year | Top 3 took, of purchasing power | Top 3 share of the rise | Top 3 share of the years | Shuffled median | Top 3 episodes |
|---|---|---|---|---|---|---|
| Japanese yen (1946) | ×45.6 | 96.9% | 91% | 37% | 50% | 1947–49, 1960–81, 1951–54 |
| French franc, then euro (1951) | ×18.4 | 85.3% | 66% | 32% | 28% | 1968–85, 1958–60, 1962–64 |
| German mark, then euro (1924) | ×10.1 | 63.7% | 44% | 17% | 22% | 1970–77, 1946–49, 1979–83 |
Germany from 1924 is the one clear exception: its three largest episodes took 63.7% of its purchasing power, below the 79.6% floor of the 13, and hold 44% of the rise; it takes four to pass half. Starting in 1924 leaves the First World War and the 1923 hyperinflation outside the window, and the series records no episode at all during the Second World War. Its 1970s also splits in two, 1970–77 and 1979–83.
Why this is not just “a few bad years”
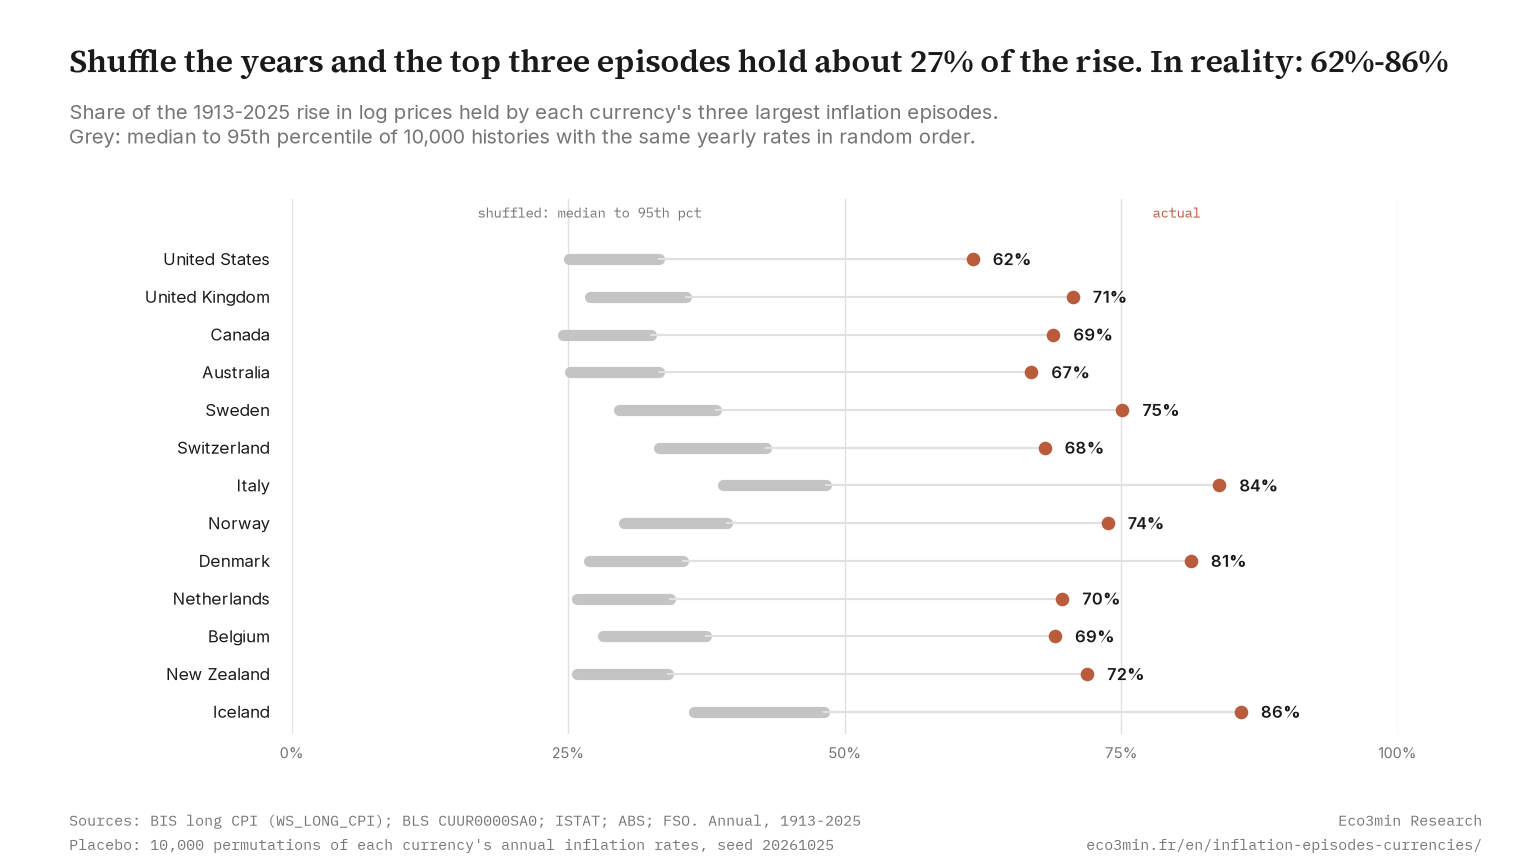
Any price series has some years far worse than others. In these 13 currencies, the worst 10% of years hold a median 39% of the price rise. That much is a Pareto-style fact, true of most price series.
The test is a shuffle. Keep every annual change exactly as it was, put them back in random order, apply the same episode rule, and record what the three largest episodes hold. Repeated 10,000 times per currency, the shuffled series give a median of 27%. The real series give 71%. The shuffle keeps every bad year, so the gap comes from order alone. The bad years came in long runs, next to each other.
The same test is less flattering for the full set of episodes. Counting every episode rather than the three largest, the real share is not unusual: it beats the shuffles at the 5% level in only 2 of the 13 currencies. Iceland’s all-episode share is 104%, because years outside episodes include falling prices that offset part of the rise. What sets the real series apart, in all 13 currencies, is that most of the rise sits in three long runs.
Method
Rule
An episode is a run of consecutive years with annual inflation above 3% that contains at least one year above 5%. No minimum total rise, no merging of neighbouring runs. Episodes are named after the fact, by overlap with reference windows (First World War, Second World War, post-war, 1970s), and names never change which years are in an episode.
Window
Annual averages of the consumer price index, base 1913 = 100, 112 annual changes from 1914 to 2025. Canada, Switzerland and New Zealand start in 1914 (111 changes), the first year with a licensable value. 2026 is not used.
Pre-registration
The rule, the statistics, the shuffle and the sensitivity grid were written down on 25 October 2026, when only the US series had been examined, and frozen (SHA-256 9e911cf0…3786c8c8). Seven later changes, each dated and explained, are in the changelog. Five concern the data and the sample: a change of source set for licensing reasons, the 1914 base for three countries, the six appendix currencies, Belgium’s gaps and the national segments chained before the first BIS year. Two add results without changing any frozen one: the purchasing-power measure used in the title, computed from the frozen shares, and the test of South Africa and Ireland from 1922.
Sensitivity
Three upper thresholds (4, 5, 6%), three lower thresholds (2, 3, 4%), one or two years above the upper threshold, and a merge gap of zero or one year: 36 variants per currency. The top-three share stays between 52% (US dollar, with both thresholds at 4% and no merging) and 93% (Italian lira).
The March figure
The US post found 72% of the rise in 29% of the time with a monthly rule and four episodes; the code here reproduces both, 72.7% and 29.4% to one decimal. Under the frozen annual rule, the US top three hold 62%. Applied to monthly data, the same frozen rule gives 51%, because year-on-year inflation dipped below 3% in 1972, which splits the US 1970s into two episodes. The numbers differ because the rules differ; the shape does not. In purchasing power, the US top three took 88.3%, and all years together 96.9%.
Net and gross
Shares are computed on the net log rise, the one that maps to “100 then, worth X today”. A gross variant, dividing by the sum of all positive annual changes, gives lower shares (US 53%); both are in the CSV.
Limits
Prices only
This measures what a unit of currency buys. It does not measure what an hour of work buys, which depends on wage series this study does not use.
Old data
Price indices before the 1950s cover fewer goods and, in war years, can record controlled prices rather than what people paid. Each country-year carries a quality grade in the CSV. Belgium has no BIS value for 1915–19 and 1941–46; those years are interpolated and flagged. Annual averages smooth the peaks of fast episodes.
Joins
Where the BIS series starts after 1913, an official national series is chained on the first common year: Italy 1913–46 (ISTAT), Australia 1913–21 (Australian Bureau of Statistics), Switzerland 1914–20 (Federal Statistical Office). France before 1951, Germany before 1924 and Japan before 1946 were not chained, for data or licensing reasons recorded before their results were computed.
Currency reforms
Price indices are ratios, so neutral redenominations (France 1960, Australia 1966, Iceland 1981, the euro in 1999) need no adjustment. Losses specific to savings, such as the German conversion of 1948, are not price changes and are not in the index.
Survivorship
The panel is the ten currencies named in the pre-registration plus every other BIS country with a series from 1914 or earlier, fixed before running them; three of the ten (Germany, Japan, France) start later and are shown apart. Countries whose statistics broke in a hyperinflation or a war are, by construction, missing. The panel therefore leans toward calmer histories, and Germany’s 1923 hyperinflation falls outside its window.
South Africa and Ireland, whose BIS series start in 1922, are outside the panel for that reason. Under the same episode rule from 1922, their three largest episodes took 99.3% and 94.4% of purchasing power, against a median of 92.9% for the 13 currencies over the same window. South Africa’s second-largest episode is recent: 2005–25, 21 straight years above 3%.
What this does and does not say
It does not name a cause
The three waves coincide with two world wars and their financing, and with the 1970s. The data shows when prices rose, not why. The 1913 base is the last full pre-war year; it is not a statement about any institution, and 12 of the 13 currencies are not the dollar.
Measurement error does not create the pattern
A steady bias in measured inflation, up or down, shifts every year by the same amount. It can move a year across the 3% or 5% line and change the shares, but it cannot put the bad years next to each other, which is what the shuffle tests.
Extreme cases do not drive the median
Drop Italy and Iceland, the two highest-inflation currencies, and the median top-three share moves from 71% to 70%, the median loss of purchasing power from 95.8% to 95.5%. The “at least 79%” comes from the other end: the Swiss franc, the currency with the smallest price rise of the 13, lost 79.6% in its three largest episodes.
It is not new that inflation comes in crises
Carmen Reinhart and Kenneth Rogoff documented inflation crises across countries and centuries in This Time Is Different (2009). The contribution here is narrower: one transparent rule applied identically to every currency, a shuffle test against chance, a measure of concentration, and the CSV and code to rerun all of it.
Gold, bitcoin and other assets are out of scope
These are consumer prices in each currency. The return on holding an asset is a separate question.
Data and code
- cpi_by_currency_1913_2025.csv: annual index, inflation, episode, source and quality grade, one row per currency and year.
- episodes_by_currency.csv: every episode, with start, end, length, price multiple, share of the rise and rank.
- summary_by_currency.csv: the statistics in the table, including purchasing power lost to the top three and to all years, shuffle results, gross variant and sensitivity range.
- sensitivity_grid.csv: the 36 rule variants for each currency.
- Code and method: pipeline.py and the run log it writes, test_za_ie_1922.py and its CSV for South Africa and Ireland (between them, every number on this page), the input series, the frozen pre-registration and the changelog.
The data may be reused with attribution to Eco3min Research and to the underlying sources below, under each source’s terms.
Data sources and references
- US Bureau of Labor Statistics, Consumer Price Index for All Urban Consumers, series CUUR0000SA0, not seasonally adjusted, annual average of monthly values (public domain).
- Bank for International Settlements, long series on consumer prices (WS_LONG_CPI), annual.
- ISTAT, coefficients for converting monetary values, 1861–2025 (CC BY 4.0), Italy 1913–46.
- Australian Bureau of Statistics, Year Book Australia 2003, table 28.4 (CC BY 4.0), Australia 1913–21.
- Swiss Federal Statistical Office, long series of the consumer price index (OPEN-BY), Switzerland 1914–20.
- Carmen M. Reinhart and Kenneth S. Rogoff, This Time Is Different: Eight Centuries of Financial Folly, Princeton University Press, 2009.
Last updated — 27 October 2026
Disclaimer – Financial and Legal Information: The analyses, commentary, and content published on eco3min.fr are provided for informational and educational purposes only. They do not constitute investment advice or a solicitation to buy or sell financial instruments. Past performance is not indicative of future results. All investment decisions involve risk and are the sole responsibility of the reader. Data, charts and calculated series are provided as is and may contain errors or lag behind their source: check any figure against the primary source cited before relying on it. Content describing laws, regulations or contracts reflects the law as of its publication date and does not constitute legal or tax advice; applying it to a specific situation requires a qualified legal or tax professional.