
Baa credit spread vs stock market peaks, 1953–2026: widening at 4 of 12 tops, wider at 9 six months on
Across the 12 US stock-market peaks since 1953, Moody’s Baa corporate bond spread, the lowest investment-grade tier, was widening in the peak month at 4 and was wider six months later at 9.
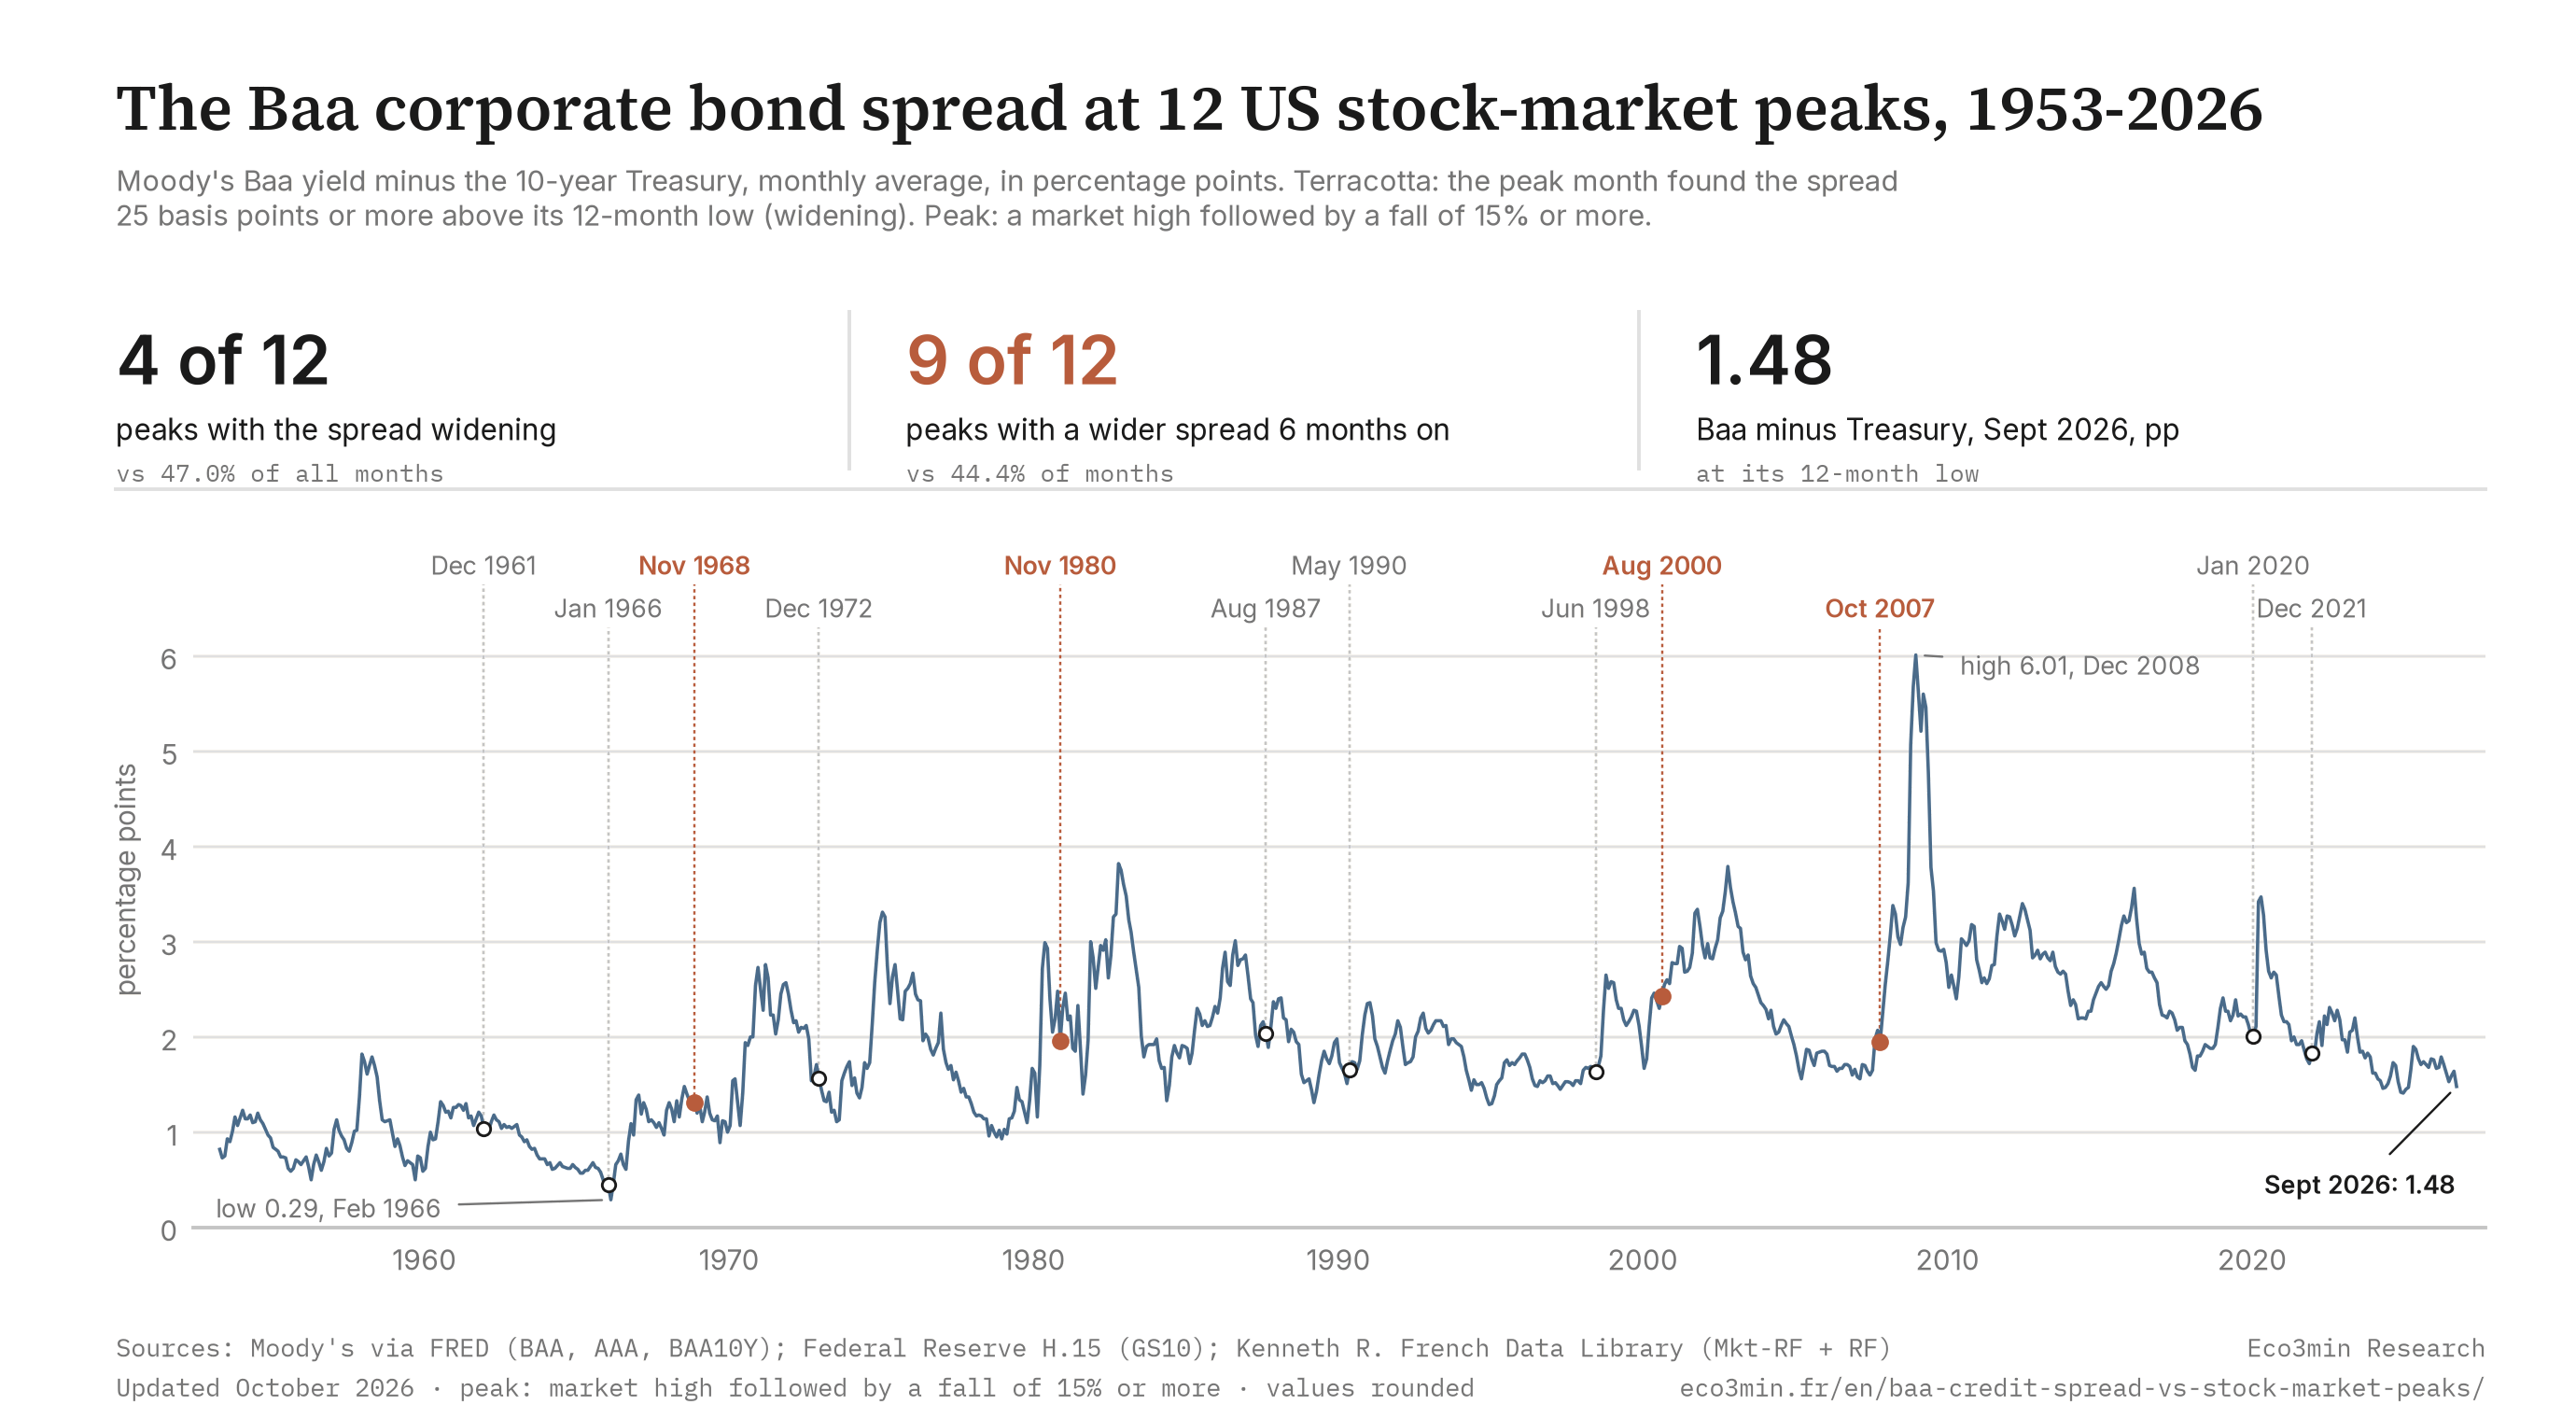
The Baa spread at the 12 US stock-market peaks since 1953
Moody’s Baa corporate bond yield minus the 10-year Treasury yield, monthly, April 1953 to September 2026. The dots mark the 12 peaks followed by a fall of 15% or more in US stocks. At 4 of them the spread stood 25 basis points or more above its 12-month low, a state found in 47.0% of all months; six months after the peak it was wider at 9.
Sources: Moody’s Seasoned Baa Corporate Bond Yield (BAA), via FRED, Federal Reserve Bank of St. Louis; Board of Governors of the Federal Reserve System, 10-Year Treasury Constant Maturity (GS10); Kenneth R. French Data Library, US market total return. Chart: Eco3min Research.
A monthly file joining Moody’s Baa and Aaa corporate bond yields, the lowest and the highest investment-grade ratings, to the 10-year Treasury and to US stock returns since July 1926, with widening flags, dated peaks and forward changes.
The Baa credit spread vs stock market peaks comparison asks a dated question: where was the gap between the yield on Moody’s Baa corporate bonds, the lowest investment-grade rating, and the 10-year Treasury yield in the month the US stock market reached a high that it lost by 15% or more? Since the 10-year Treasury series begins in April 1953, the total-return index of the US market built from the Kenneth R. French Data Library has 12 such peaks, from December 1961 to December 2021. At 4 of them the spread stood 25 basis points or more above its lowest level of the previous 12 months, a reading found in 47.0% of the 869 months of the sample. Six months after the peak the spread was wider than in the peak month in 9 of the 12 cases, against 44.4% of months.
TL;DR
At 12 US stock-market peaks since 1953, the Baa corporate bond spread was widening at 4; six months later it was wider at 9.
- In the peak month, the Baa minus 10-year Treasury spread stood 25 bp or more above its 12-month low at 4 of 12 peaks, against 47.0% of the 869 months since April 1954 and 39.1% of the 299 months in which the market closed at an all-time high. A binomial test gives 0.258 and a circular shift of the flag series 0.259: no more often than in an ordinary month.
- Six months on, the spread was wider than at the peak at 9 of 12, on Baa minus Treasury and on Baa minus Aaa alike, against 44.4% and 43.1% of months (binomial 0.033, circular shift 0.039). The correlation of each month’s spread change with the next month’s stock return has a 95% interval that includes zero on all four measures tested.
- Checked the other way: once the part of each spread move that tracks the 10-year Treasury is removed, the spread was widening at 5 of 12 peaks against 36.7% of months, above its base. The weekly BAA10Y control since 1987 gives 5 of 9 peaks against 51.4% of weeks. Neither count stands out from chance (0.467 and 0.535).
Scope: Baa is the lowest investment-grade rating, not high yield, and the study says nothing about high-yield bonds, leveraged loans or credit default swaps. It measures co-movement, not causation, and contains no forecast and no signal. Method in the methodology, reservations in the limitations.
Latest observation
Baa minus 10-year Treasury
1.48 pp
September 2026 monthly average, 29.3rd percentile since April 1953
Above its 12-month low
0 bp
September 2026 is the 12-month low; the widening flag is off
Baa minus Aaa
0.44 pp
1 bp above its own 12-month low
US stock market
All-time high
total return, August 2026, the latest month of the French library
Moody’s Baa yield averaged 6.47% in September 2026, the Aaa yield 6.03% and the 10-year Treasury 4.99%. The month-end BAA10Y reading was 1.47. The spread stood at 1.64 in August and 1.59 in July. Moody’s monthly averages appear on FRED in the first days of the following month and the French library updates monthly. Updated monthly.
Summary
Six findings
- At 12 US stock-market peaks since 1953, the Baa corporate bond spread was widening at 4; six months later it was wider at 9.
- The state of the spread in the peak month is what an ordinary month shows. Shifting the whole flag series against the 12 peak dates by each of its 869 possible offsets, which keeps the persistence of widening spells intact, gives a mean of 5.63 flagged peaks, and 4 or fewer in 25.9% of the shifts. On the months in which the market closed at a high, the base is 39.1% and the conclusion holds.
- After the peak the contrast is significant. Over the next six months the spread widened at 9 of 12 peaks on both measures, with a median change of +0.32 point against −0.04 for all months. The three exceptions are November 1968, December 1972 and November 1980.
- Month by month, the spread follows the market. The correlation of a period’s spread change with the previous period’s stock return runs from −0.21 to −0.42 across four measures (Baa minus Treasury and Baa minus Aaa in monthly averages, BAA10Y at month end and weekly), and each 95% interval lies below zero. With the next period’s return, every interval includes zero.
- In September 2026 the spread, at 1.48 point, sat at its 12-month low while the US market closed August at an all-time high. The widening flag would need a monthly spread of 1.73 or more while that low stays in the window, through September 2027.
- The file holds 1,203 months from July 1926 to September 2026 in 35 data columns, and every flag and peak date can be rebuilt from the yields and returns it publishes. Eco3min text and analysis: CC BY 4.0. Data, files and charts remain subject to their producer’s terms, stated on each page; Eco3min grants no licence over third-party data. Moody’s yields are copyrighted and published with a citation requirement.
The record in six numbers
4 of 12
peaks with the spread 25 bp or more above its 12-month low, against 47.0% of months
9 of 12
peaks with a wider spread six months later, against 44.4% of months
0.259
probability of 4 or fewer flagged peaks on a circular shift of the 869 months
−0.43
monthly change in Baa minus Treasury per point of change in the 10-year yield
1.84 pp
median Baa minus 10-year Treasury since April 1953; low 0.29, high 6.01
−36.30%
mean decline after the 4 flagged peaks, against −24.28% after the 8 others: four cases, too few for a test
Why credit is expected to turn first
The reading tested here is one of the most repeated in market commentary: the bond market sees trouble first. The argument holds together. A bondholder’s claim ranks ahead of the shareholder’s and its upside is capped, so its price turns on the probability of default and little else. In Robert Merton’s 1974 model of corporate debt, equity is a call option on the firm’s assets and the bond is a safe claim minus a put on the same assets, so both prices answer to the value of the firm and to its volatility. Late in a cycle leverage builds, lenders tighten, and the weakest investment-grade borrowers pay more first. The site’s own guide to what credit spreads say about recessions sets out that chain, and the academic record backs it for the real economy: Gilchrist and Zakrajšek’s 2012 credit-spread index, built bond by bond, carries information about employment and output several quarters ahead.
An earlier Eco3min page on this subject measured, on a high-yield index from 1997, the months from each spread trough to the following stock-market peak. The test here dates the peaks from stock returns alone and then reads the spread in the peak month.
The test needs two definitions. A peak is a month in which the US market’s total-return index closed at a high that it did not regain before falling 15% or more. The dates come from stock returns, with no reference to credit. The spread is widening in a month when it stands 25 basis points or more above its lowest monthly value of the previous 12 months. Since April 1954 that flag has been on in 47.0% of months, so a spread that marked the tops would show a share well above 47% at the 12 peak months. The record runs in the other order: the spread widened after the peaks far more consistently than in the peak month.
Twelve peaks, four widening spreads, then nine wider ones six months on.
The spread in the peak month
In the peak month the spread stood 25 basis points or more above its 12-month low at four peaks: November 1968 (34 bp), November 1980 (80 bp), August 2000 (76 bp) and October 2007 (39 bp). At the eight others it was within 14 bp of that low, and in December 1961 and January 2020 it sat on the low itself. The depth and duration of each decline on a price index are in the site’s catalogue of every large US stock drawdown since 1950; here the peaks are dated on total return.
Four of twelve is 33.3%. Across all 869 months the reading was on 47.0% of the time. Across the 299 months in which the market closed at an all-time high, the closer comparison for a peak, 39.1%. A binomial test of 4 or fewer successes in 12 draws at 47.0% gives 0.258. That test treats months as independent, and they are not: a widening spell lasts months. The circular shift answers the objection. It slides the whole flag series against the fixed peak dates by every possible offset, 869 in all, and counts the flagged peaks each time. The mean is 5.63, and 4 or fewer comes up in 25.9% of the shifts.
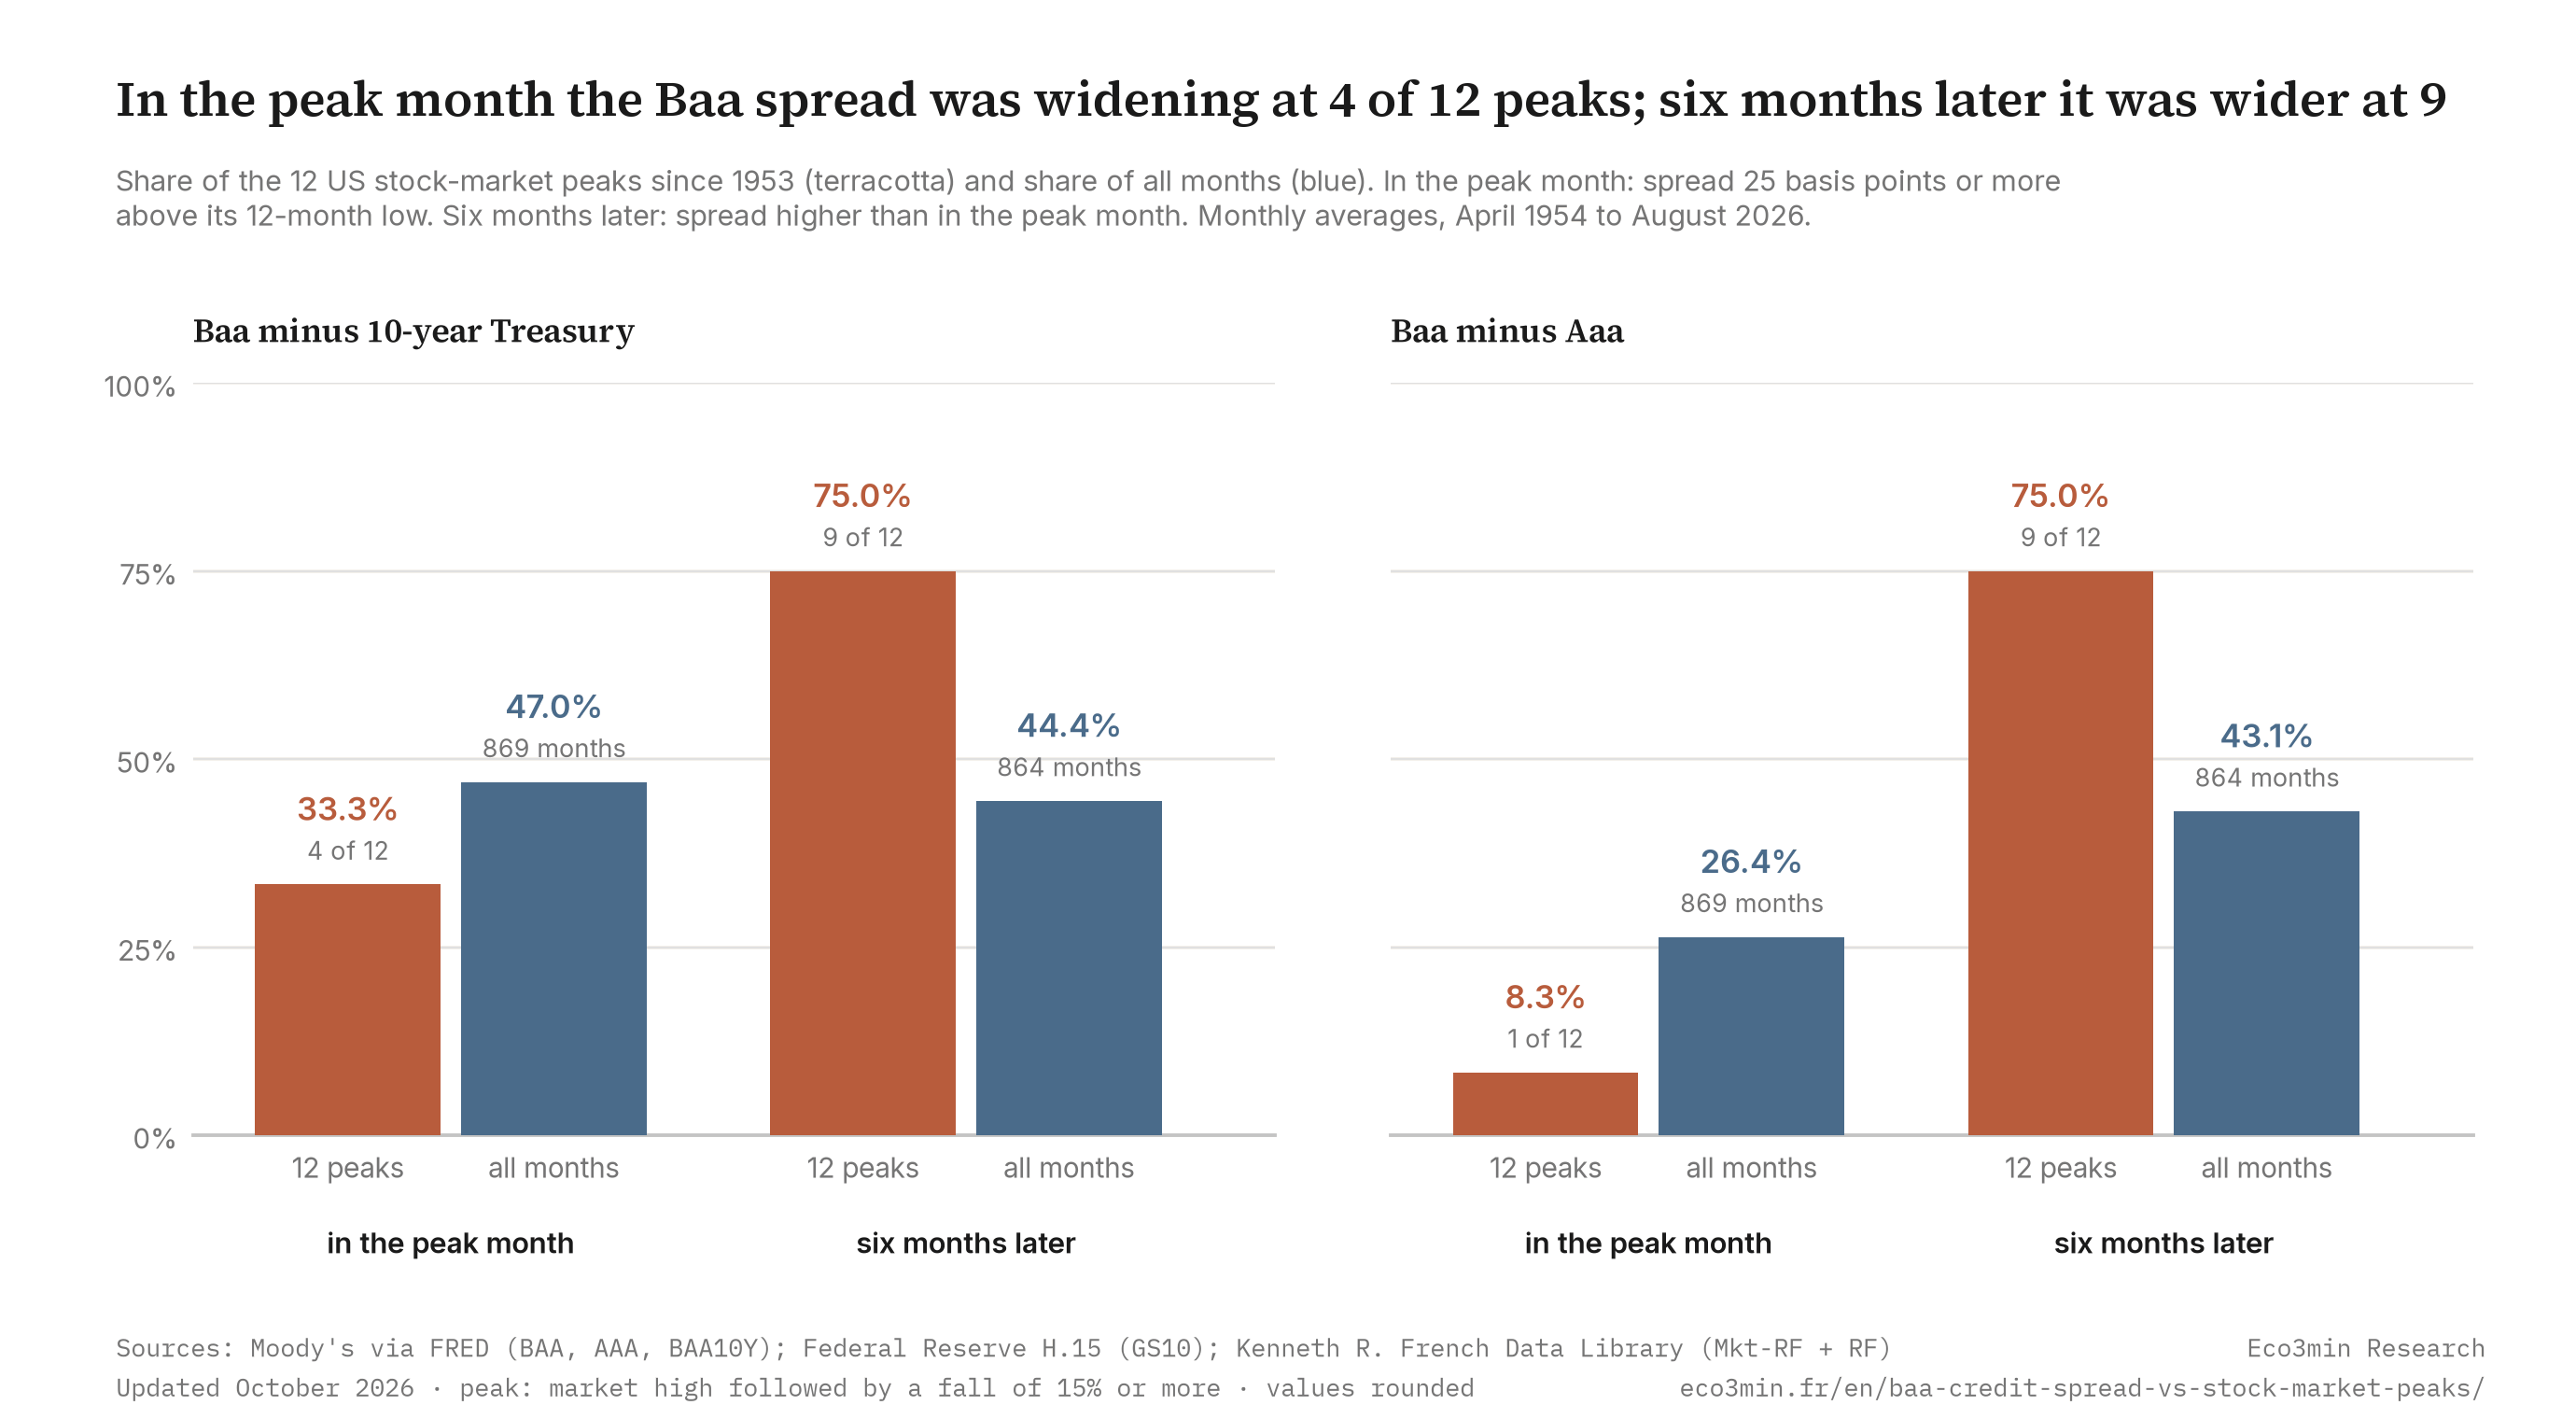
In the peak month and six months on: the Baa spread at 12 US stock-market peaks, against all months
Share of the 12 peaks since 1954 with the spread 25 bp or more above its 12-month low in the peak month, and with a wider spread six months later, set against the same share across all months. Baa minus 10-year Treasury: 4 of 12 against 47.0%, then 9 of 12 against 44.4%. Baa minus Aaa: 1 of 12 against 26.4%, then 9 of 12 against 43.1%.
Sources: Moody’s BAA and AAA via FRED; Board of Governors, GS10; Kenneth R. French Data Library. Peaks: highs followed by a fall of 15% or more in the US total-return index, April 1954 to August 2026. Chart: Eco3min Research.
Each pair of bars sets the 12 peaks against every month of the sample. A spread that marked the tops would put the left bar of each pair above the right one. A spread that answers to the decline would do so in the second pair. The first pair sits below its base on both measures, the second well above it.
What this dataset does not measure
Moody’s Baa index averages the yields of seasoned corporate bonds rated Baa, the lowest investment-grade tier, with maturities of 20 years and above, and the published series is the average of the month’s daily values. It is not high yield: bonds rated below Baa, leveraged loans, private credit and credit default swaps are outside the file, as are the bond-by-bond spreads of the academic literature. The question page on investment grade versus high yield debt sets out what separates the segments. The 10-year Treasury is shorter than the bonds in the index, so Baa minus Treasury also carries part of the yield curve. A concrete case: over the 12 months to October 2007 the Baa yield rose 0.06 point while the 10-year Treasury fell 0.20, which put the spread 39 bp above its 12-month low at that peak. Baa minus Aaa, two Moody’s indexes of the same maturity, fell 0.09 point over the same months. The October 2007 reading came from the Treasury side.
Takeaway
In the peak month the Baa spread looked as it does in an ordinary month: widening at 4 of 12 peaks against 47.0% of months, a count that a circular shift of the same series reproduces or undercuts 25.9% of the time.
Six months after the peak
Six months after the peak the spread was wider at nine of the twelve. The largest moves followed October 2007, +1.34 point, June 1998, +0.95, January 2020, +0.68, and May 1990, +0.58. Two of the three exceptions, November 1968 and November 1980, are peaks at which the spread was already widening. The third is December 1972. Baa minus Aaa gives the same nine and the same three. Across the 864 months whose six-month window has elapsed, a wider spread six months on is a 44.4% event for Baa minus Treasury and a 43.1% event for Baa minus Aaa. Nine of twelve against 44.4% gives 0.033 on a binomial test, and 0.039 on the circular shift, whose mean is 5.33. The median six-month change after a peak is +0.32 point, against −0.04 for all months.
The mechanism runs from stocks to credit at least as much as the other way. In Merton’s framework a fall in the market value of equity raises leverage measured at market prices and brings the firm closer to its default point, which the bond price records. A falling market also tightens financing for the weakest investment-grade issuers. The site’s question page on why credit spreads widen in recessions follows the same chain into the real economy.
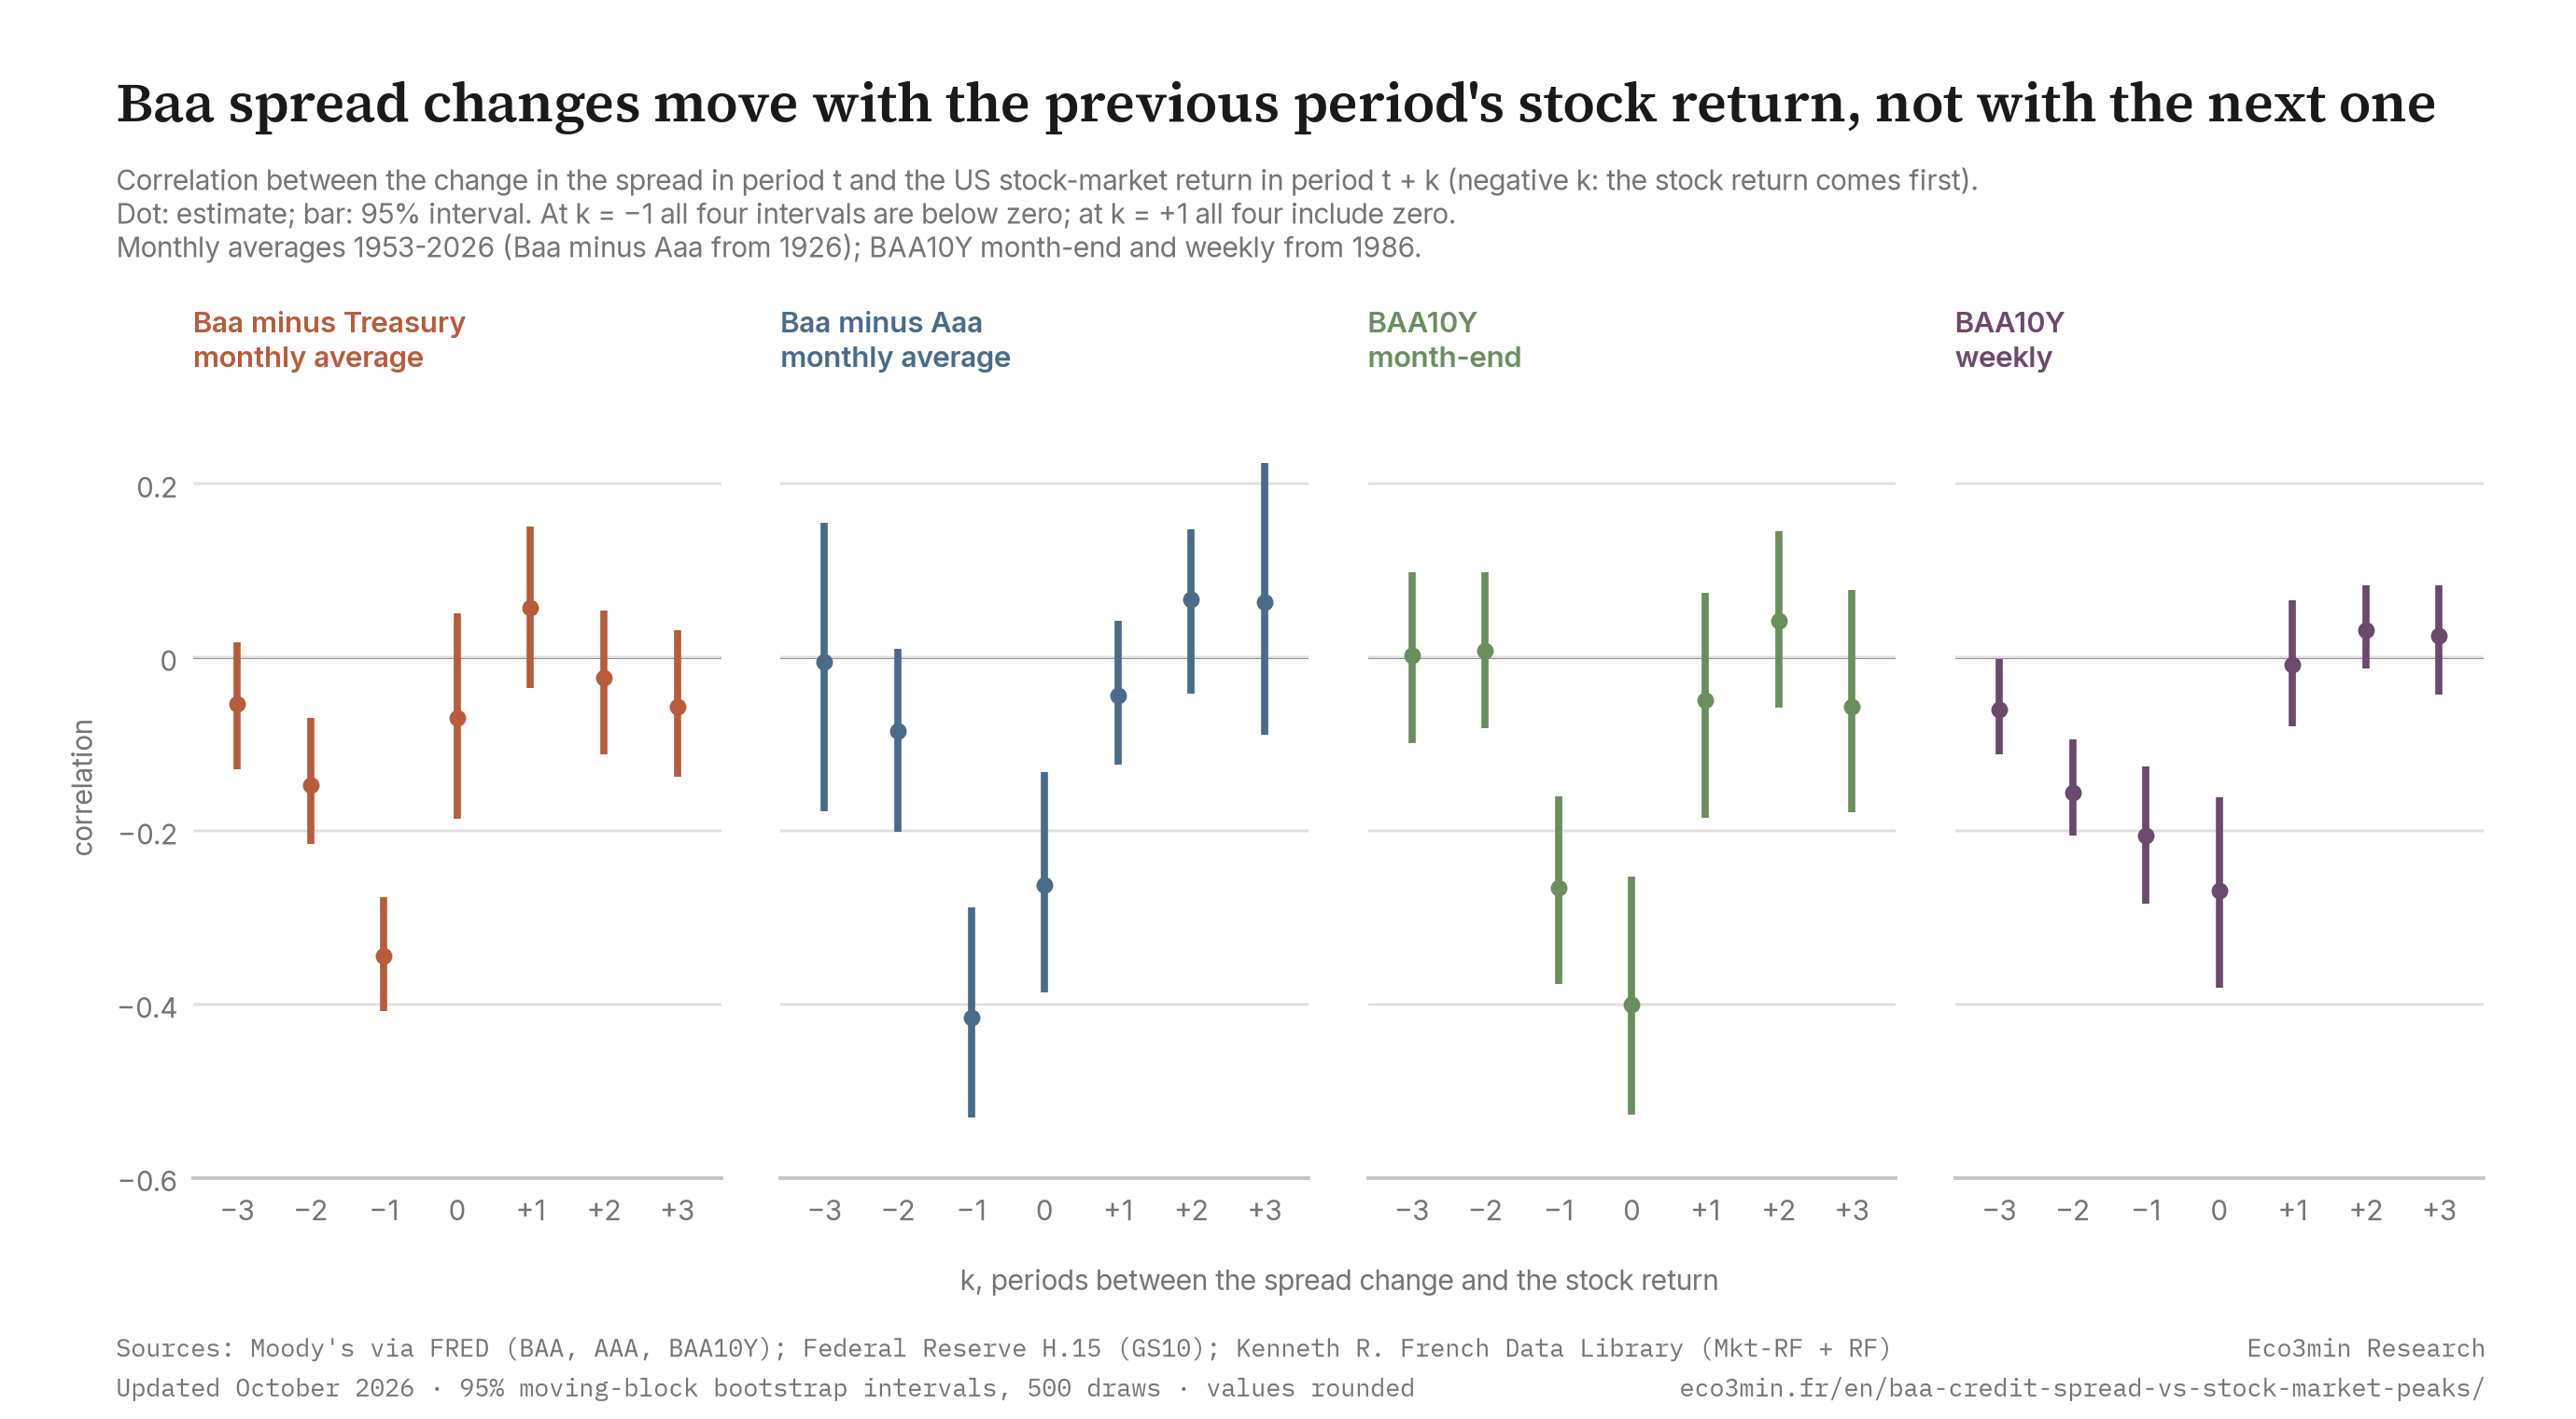
Spread changes and stock returns: the same period, the three before and the three after
Correlation of each period’s change in the Baa spread with the US stock return k periods away, with 95% block-bootstrap intervals, on four measures. With the next period’s return the interval includes zero on all four; with the previous period’s return it lies below zero on all four.
Sources: Moody’s BAA, AAA and BAA10Y via FRED; Board of Governors, GS10; Kenneth R. French Data Library, monthly and daily. Intervals: moving-block bootstrap, 500 draws, 6-month and 13-week blocks. Chart: Eco3min Research.
The monthly correlations show the same order at a finer grain. On the monthly average of Baa minus Treasury, the spread’s change in a month has a correlation of −0.34 with the previous month’s stock return, interval −0.41 to −0.28, of −0.07 with the same month’s, and of +0.06 with the next month’s, interval −0.04 to +0.15. Part of the first figure is arithmetic. A change between two monthly averages spans the second half of the previous month and the first half of the current one, so it absorbs part of the previous month’s market move by construction. The month-end and weekly readings of BAA10Y remove that overlap. At month end the correlation is −0.40 with the same month’s return and −0.27 with the previous month’s; weekly, −0.27 and −0.21. With the next period’s return it is −0.05 at month end and −0.01 weekly, and the intervals include zero.
Takeaway
Six months after 9 of 12 peaks the Baa spread was wider, against 44.4% of months. On each of the four measures, the spread’s change is correlated with the stock return of the same or the previous period and not with the next one.
The four widening peaks, and the measure that disagrees
Four peaks do fit the reading. In November 1968, November 1980, August 2000 and October 2007 the spread was widening in the peak month, and it stood at the 91st, 84th, 89th and 66th percentile of its history to date. These four peaks were followed by a mean decline of −36.30%, against −24.28% after the eight others. A count of peaks treats a 15% correction and a 50% bear market alike, and on four cases against eight the gap is a pattern to note, not a test.
Decomposed over the 12 months to each peak, 1980 is the clean case: the Baa yield rose 2.65 points, the Treasury 2.03, and Baa minus Aaa rose 0.44, the one peak flagged on both spreads. In 1968 Baa minus Aaa rose 0.17. In 2000 and 2007 it fell, by 0.04 and 0.09, while the Treasury fell 0.11 and 0.20. On Baa minus Aaa alone, with the same 25 bp rule, 1 of 12 peaks is flagged, against 26.4% of months.
The measure that disagrees is the rate-adjusted spread. Baa minus Treasury moves against the Treasury itself: each point of rise in the 10-year yield has come with a fall of 0.4300 point in the spread, a monthly correlation of −0.624 over 881 changes, while Baa minus Aaa has a correlation of −0.323 with the same Treasury moves. Removing 0.43 times each month’s Treasury change from each spread change and applying the same 25 bp rule gives 5 of 12 flagged peaks, August 1987 added to the four above, against 36.7% of months and 17.7% of months at a market high. On that measure the count moves above its base, the opposite side from the headline count. It is still a count that chance produces often: 0.467 on a binomial test, 0.473 on the circular shift. The coefficient is estimated on the whole sample, information no one had at the time, and the file publishes both versions.
The weekly control points the same way. On Friday closes of BAA10Y since 1987 and weekly returns cumulated from the French daily file, the spread stood 25 bp or more above its 52-week low at 5 of 9 weekly peaks, against 51.4% of weeks, a count a binomial test puts at 0.535. The flagged weeks are August 1987, July 1990, March 2000, October 2007 and September 2018. On month-end BAA10Y since 1987 the count is 2 of 7 against 46.4%, and the monthly averages give 2 of the same 7.
Widening the window does not change the comparison. If the flag counts when it is on in any of the N months up to and including the peak, the count rises with N and so does the base: 7 of 12 against 60.7% of months for three months, 7 of 12 against 69.6% for six, 9 of 12 against 81.4% for twelve. Across the 60 combinations of decline threshold (10, 15, 20 and 25%), rise threshold (10, 15, 25, 35 and 50 bp) and low window (6, 12 and 24 months), 23 put the share of flagged peaks above the share of flagged months. All 12 combinations at 10 bp are among them. Of the 11 others, 8 sit at the 25% decline threshold, which counts 5 peaks.
One more fact cuts against the alarm reading of the spread. Its level has a correlation of +0.084 with the market’s return over the following 12 months, and +0.193 for Baa minus Aaa: if anything, wide spreads were followed by higher returns, the behaviour of a risk premium. The site’s list of common mistakes about credit spreads covers the level-versus-change confusion that this result illustrates.
Takeaway
The spread was widening in the peak month in 1968, 1980, 2000 and 2007, and those four peaks were followed by deeper declines on average. Net of the Treasury’s own moves the count rises to 5 of 12, above its 36.7% base, and neither that count nor the weekly 5 of 9 stands out from chance.
Set the threshold, the window and the horizon
The study reports one rule, and a reader with a different threshold in mind has no reason to accept it. The module below recomputes the test from the published CSV. Choose the measure (Baa minus 10-year Treasury since 1953, Baa minus Aaa since 1927, the rate-adjusted variant, month-end BAA10Y since 1987), the decline that defines a peak (10, 15, 20 or 25%) and the horizon (the peak month, or 3, 6 or 12 months after it). Each cell of the matrix crosses a rise threshold, from 10 to 50 bp, with a low window of 6, 12 or 24 months, and shows the number of flagged peaks against the share of flagged months. A second line gives the share of peaks with a wider spread at the chosen horizon against the same share across all months. A click on a cell lists the peaks one by one, with the spread in the peak month and at the horizon. The default view uses the 25 bp, 12-month rule: 4 of 12 against 47.0% in the peak month, 9 of 12 wider six months on against 44.4%.
The module reads the published CSV directly. If it does not load, the chart shown in its place is the static version of the default view.
What the market did after widening and quiet months
The natural benchmark for this question is the stock market itself. The table classifies each month since April 1954 by the state of the Baa minus Treasury spread and reports the market’s total return over the next 6 and 12 calendar months, with the interquartile range and the share of positive 12-month returns, and the median of the largest fall within the 12 months. It uses the 857 months whose 12-month window has elapsed. Windows overlap, so neighbouring months share most of their path and the effective sample is far smaller than the counts.
| State of the spread | Months | Median return, 6 months | Median return, 12 months | IQR, 12 months | Positive at 12 months | Median max drawdown, 12 months |
|---|---|---|---|---|---|---|
| Widening | 404 | +7.49% | +15.53% | +2.64% to +26.54% | 78.7% | −7.61% |
| Not widening | 453 | +6.36% | +12.76% | +1.48% to +19.92% | 77.7% | −7.23% |
| All months | 857 | +6.87% | +14.17% | +1.97% to +22.87% | 78.2% | −7.38% |
| Market at a high, widening | 114 | +7.62% | +14.90% | +5.36% to +24.21% | 83.3% | −6.86% |
| Market at a high, not widening | 178 | +6.72% | +12.51% | +0.81% to +17.95% | 76.4% | −6.65% |
Widening months were followed by a median 12-month return of +15.53%, against +12.76% after the others, and the median drawdown within the year differs by 0.38 point. The same order holds on the months in which the market stood at a high. One reading is that a widening spread has more often marked a higher risk premium than an approaching top. Past distributions are not predictive of future outcomes. Regime-conditional statistics describe historical patterns, not expected returns.
Levels to watch
The 1.73 line
The September 2026 spread, 1.48, is its own 12-month low, so the widening flag is off. If a monthly average of 1.73 or more printed while that low stays in the window, through September 2027, the flag would switch on.
A 15% decline
The market closed August 2026 at an all-time high. If the total-return index fell 15% or more from a high, August 2026 or a later month would be dated as the 13th peak of the sample. At 9 of the 12 previous peaks the spread was wider six months later, by a median of +0.32 point.
The next data points
Moody’s October 2026 monthly averages of the Baa and Aaa yields reach FRED in early November 2026, with the 10-year Treasury average. The Kenneth R. French Data Library adds September 2026 returns at its next monthly update.
The twelve peaks, line by line
Each row is a peak followed by a fall of 15% or more in the US total-return index. Spreads are in percentage points and the rise above the 12-month low in basis points. The three 12-month changes, in points, end in the peak month, and the last column is the change in Baa minus Treasury over the following six months.
| Peak | Trough | Decline | Baa minus Treasury | Percentile to date | Above 12-month low, bp | Widening | Baa, 12-month change | Treasury, 12-month change | Baa minus Aaa, 12-month change | Spread, next 6 months |
|---|---|---|---|---|---|---|---|---|---|---|
| 1961-12 | 1962-06 | −23.07% | 1.04 | 58 | 0 | no | 0.00 | +0.22 | −0.07 | +0.07 |
| 1966-01 | 1966-09 | −15.49% | 0.45 | 1 | 5 | no | +0.26 | +0.42 | −0.05 | +0.21 |
| 1968-11 | 1970-06 | −33.55% | 1.31 | 91 | 34 | yes | +0.29 | −0.05 | +0.17 | −0.11 |
| 1972-12 | 1974-09 | −46.51% | 1.57 | 85 | 3 | no | −0.45 | +0.43 | −0.28 | −0.34 |
| 1980-11 | 1982-07 | −16.34% | 1.96 | 84 | 80 | yes | +2.65 | +2.03 | +0.44 | −0.11 |
| 1987-08 | 1987-11 | −29.85% | 2.04 | 76 | 14 | no | +0.62 | +1.59 | −0.33 | +0.37 |
| 1990-05 | 1990-10 | −16.92% | 1.65 | 60 | 14 | no | −0.05 | −0.10 | +0.05 | +0.58 |
| 1998-06 | 1998-08 | −17.32% | 1.63 | 56 | 14 | no | −0.89 | −0.99 | −0.01 | +0.95 |
| 2000-08 | 2002-09 | −44.99% | 2.43 | 89 | 76 | yes | +0.11 | −0.11 | −0.04 | +0.34 |
| 2007-10 | 2009-02 | −50.31% | 1.95 | 66 | 39 | yes | +0.06 | −0.20 | −0.09 | +1.34 |
| 2020-01 | 2020-03 | −20.22% | 2.01 | 58 | 0 | no | −1.35 | −0.95 | −0.36 | +0.68 |
| 2021-12 | 2022-09 | −24.84% | 1.83 | 49 | 11 | no | +0.14 | +0.54 | −0.25 | +0.30 |
The same 25 bp rule on the other measures in the file, in the peak month. The circular-shift column gives the probability of the observed count or fewer.
| Measure | Window | Peaks flagged | All months | Months at a market high | Circular shift, count or fewer |
|---|---|---|---|---|---|
| Baa minus 10-year Treasury | 1954-04 to 2026-08 | 4 of 12 | 47.0% | 39.1% | 0.259 |
| Baa minus Aaa | 1954-04 to 2026-08 | 1 of 12 | 26.4% | 13.7% | 0.123 |
| Baa minus Aaa, 15 bp rule | 1954-04 to 2026-08 | 3 of 12 | 37.4% | 23.4% | 0.288 |
| Baa minus Aaa | 1927-07 to 2026-08 | 2 of 14 | 25.2% | 11.7% | 0.256 |
| Baa minus Aaa, 15 bp rule | 1927-07 to 2026-08 | 4 of 14 | 37.4% | 23.4% | 0.320 |
| Rate-adjusted Baa minus Treasury | 1954-04 to 2026-08 | 5 of 12 | 36.7% | 17.7% | 0.724 |
| BAA10Y, month end | 1987-01 to 2026-08 | 2 of 7 | 46.4% | 37.3% | 0.303 |
Historical turning points
January 1966, the narrowest spread at a peak. Baa minus Treasury stood at 0.45 point, the 1st percentile of its history to that date, 5 bp above its 12-month low. The next month, February 1966, it reached 0.29, the lowest reading of the file. The market fell 15.49% to September 1966, and six months after the peak the spread was 0.21 point wider.
November 1980, the one peak flagged on both spreads. The Baa yield averaged 14.64% and the Treasury 12.68%. Baa minus Treasury stood 80 bp above its 12-month low and Baa minus Aaa 48 bp above its own. Six months later Baa minus Treasury was 0.11 point narrower, one of the three exceptions, and the market’s fall ran to July 1982, −16.34%.
August 2000, a wide spread at the peak. The spread was 2.43 points, the 89th percentile of its history to date and 76 bp above its 12-month low; Baa minus Aaa, at 16 bp above its low, stayed under the threshold. Six months on it was 0.34 point wider. The decline that followed, −44.99% to September 2002, is the one the site’s analysis of the 2000 dot-com crash through its indicators reconstructs.
October 2007, the largest move after a peak. The spread was 1.95 points and 39 bp above its 12-month low, with the Treasury down 0.20 point over the year and Baa minus Aaa down 0.09. Six months later it was 1.34 points wider, the largest six-month change after any of the 12 peaks. Its record high, 6.01, came in December 2008, and the market’s fall ran to February 2009, −50.31%.
January 2020, a peak at the spread’s low. The spread was 2.01 points, at its 12-month low exactly. The market fell 20.22% to March 2020 and the spread was 0.68 point wider six months after the peak.
September 2026, the current observation. The spread is 1.48 points, at its 12-month low, and the market closed August 2026 at an all-time high. No peak can be dated until a decline of 15% or more has occurred.
Methodology
The yields are Moody’s Seasoned Baa and Aaa corporate bond yields, FRED series BAA and AAA, monthly averages of daily values, from July 1926. The 10-year Treasury constant-maturity yield is FRED GS10, from the Board of Governors’ H.15 release, a monthly average from April 1953. BAA10Y, Moody’s Baa relative to the 10-year Treasury, daily, taken at the last observation of each month from January 1986. Stock returns come from the Kenneth R. French Data Library, Fama/French 3 Factors, as Mkt-RF plus RF: the value-weighted total return of NYSE, AMEX and Nasdaq stocks, July 1926 to August 2026, cumulated into an index. The site’s real corporate bond yield dataset publishes the Baa yield net of inflation, and the daily 10-year Treasury yield dataset the other leg.
Spreads and the widening flag
baa_gs10_spread_pp = BAA − GS10 · baa_aaa_spread_pp = BAA − AAA · rise_12m_low_bp(t) = (S(t) − min S(t−12 … t)) × 100 · widening(t) = 1 if rise_12m_low_bp(t) ≥ 25
Peaks
P(t) = cumulative total-return index, base 100 in June 1926 · a peak at threshold X is a month t with P(t) at its running maximum, followed by a fall of X% or more from P(t) before any month in which P regains P(t) · X = 10, 15, 20, 25 · the headline uses X = 15
Rate-adjusted variant
dA(t) = dS(t) − β × dGS10(t), β = OLS slope of dS on dGS10, April 1953 to September 2026 = −0.4300 · A cumulated from the April 1953 spread · same 25 bp, 12-month rule on A
Tests. The binomial test compares the count of flagged peaks with the share of flagged months as if months were independent. The circular shift keeps the flag series intact and moves it against the fixed peak dates by each of its 869 offsets, wrapping around the end, so the persistence of widening spells survives in every draw. The reported probability is the share of offsets with a count at or below the observed one, or at or above it for the six-month test. On the rate-adjusted index A the 25 bp rule flags 5 of 12 peaks against 36.7% of months, 0.467 on a binomial test and 0.473 on the circular shift, against 4 of 12 and 47.0% on the unadjusted spread. Lead-lag correlations relate the change in the spread in period t to the stock return in period t + k, k from −3 to +3, and their intervals come from a moving-block bootstrap of 500 draws with 6-month blocks on monthly data and 13-week blocks on weekly data.
Window up to the peak. The flag counted when on in any month of the N months up to and including the peak:
| N, months | Peaks flagged | All months |
|---|---|---|
| 0 | 4 of 12 | 47.0% |
| 3 | 7 of 12 | 60.7% |
| 6 | 7 of 12 | 69.6% |
| 12 | 9 of 12 | 81.4% |
Sensitivity. Baa minus Treasury in the peak month, by rise threshold and low window (rows) and decline threshold (columns): flagged peaks against the share of flagged months.
| Rise, low window | Decline ≥ 10% | Decline ≥ 15% | Decline ≥ 20% | Decline ≥ 25% |
|---|---|---|---|---|
| 10 bp, 6 months | 9/17 vs 51% | 7/12 vs 51% | 5/8 vs 51% | 4/5 vs 51% |
| 10 bp, 12 months | 12/17 vs 62% | 8/12 vs 62% | 5/8 vs 62% | 4/5 vs 62% |
| 10 bp, 24 months | 15/17 vs 74% | 10/12 vs 74% | 7/8 vs 74% | 4/5 vs 74% |
| 15 bp, 6 months | 4/17 vs 43% | 3/12 vs 43% | 3/8 vs 43% | 3/5 vs 43% |
| 15 bp, 12 months | 7/17 vs 56% | 4/12 vs 56% | 3/8 vs 56% | 3/5 vs 56% |
| 15 bp, 24 months | 12/17 vs 69% | 8/12 vs 69% | 5/8 vs 69% | 3/5 vs 69% |
| 25 bp, 6 months | 3/17 vs 33% | 2/12 vs 33% | 2/8 vs 33% | 2/5 vs 33% |
| 25 bp, 12 months | 5/17 vs 47% | 4/12 vs 47% | 3/8 vs 47% | 3/5 vs 47% |
| 25 bp, 24 months | 10/17 vs 59% | 7/12 vs 59% | 5/8 vs 59% | 3/5 vs 59% |
| 35 bp, 6 months | 3/17 vs 25% | 2/12 vs 25% | 2/8 vs 25% | 2/5 vs 25% |
| 35 bp, 12 months | 4/17 vs 39% | 3/12 vs 39% | 2/8 vs 39% | 2/5 vs 39% |
| 35 bp, 24 months | 7/17 vs 51% | 5/12 vs 51% | 4/8 vs 51% | 2/5 vs 51% |
| 50 bp, 6 months | 2/17 vs 15% | 1/12 vs 15% | 1/8 vs 15% | 1/5 vs 15% |
| 50 bp, 12 months | 3/17 vs 26% | 2/12 vs 26% | 1/8 vs 26% | 1/5 vs 26% |
| 50 bp, 24 months | 4/17 vs 40% | 2/12 vs 40% | 1/8 vs 40% | 1/5 vs 40% |
Sub-periods. On the peaks and months of 1954 to 1985 the count is 2 of 5 against 47.5% of months, and on 1986 to 2026 it is 2 of 7 against 46.5%. Starting in 1963 gives 4 of 11 against 47.9%, starting in 1973 gives 3 of 8 against 49.1%. The 12 peaks dated on the index rebased in April 1953 are the same as those dated on the index from 1926.
The trough-to-peak rule. The earlier page measured, for each stock-market peak, the month of the lowest spread in a window ending at the peak, and called the gap a lead. Applied to the Baa spread with a 24-month window, that rule finds the low strictly ahead of the peak at 12 of 12 peaks, with a median gap of 11.0 months. Applied with the same window to 2,000 random walks with no link to stocks, it finds one at 10.6 of 12 peaks on average, with a median gap of 11.5 months, and 22% of the random walks match or beat the Baa count. With a 12-month window the figures are 10 of 12 and 3.0 months for Baa against 9.9 and 5.5 for the random walks. With 36 months, 12 of 12 and 25.0 against 10.8 and 17.5. A low found in a window that ends at the peak sits ahead of it by construction, whatever the series.
Literature. The pricing link between equity and corporate debt follows Merton (1974). The evidence that credit spreads carry information about activity, which the Baa record does not dispute, rests on bond-level spreads such as Gilchrist and Zakrajšek (2012) and is reviewed in the site’s piece on how far leading indicators anticipate the cycle. The market return is the excess market return published by the Kenneth R. French Data Library, the market factor of Fama and French (1993), plus the risk-free rate. The block bootstrap follows Künsch (1989).
Filter definitions
Since 1953: Baa minus Treasury begins in April 1953 with GS10, and the 12-month low needs 12 prior months, so flags begin in April 1954 · MAIN: the 869 months from April 1954 to August 2026 with a flag and a market return, 12 peaks · months at a market high: MAIN months in which the total-return index closed at an all-time high, 299 · six months on: MAIN months whose six-month-ahead spread change is observed, April 1954 to March 2026, 864 · since 1927: Baa minus Aaa months from July 1927 to August 2026 with a flag and a market return, 14 peaks · since 1987: month-end BAA10Y months from January 1987 to August 2026, 7 peaks; weekly BAA10Y Fridays from January 2, 1987 to September 4, 2026, 9 peaks · 1954 to 1985 and 1986 to 2026: MAIN months and peaks inside April 1954 to December 1985 and January 1986 to August 2026 · from 1963, from 1973: MAIN months and peaks from January 1963 and from January 1973
Reproducibility. In Python, on the published file:
import pandas as pd
d = pd.read_csv(“https://eco3min.fr/wp-content/uploads/2026/10/credit-baa-peaks-2026.csv”, index_col=”month”)
m = d.loc[“1954-04″:”2026-08”]m = m[m.baa_gs10_widening.notna() & m.us_mkt_ret_pct.notna()]pk = m[m.mkt_peak_15 == 1]print(int(pk.baa_gs10_widening.sum()), len(pk), round(m.baa_gs10_widening.mean(), 3))
print(int((pk.baa_gs10_chg_fwd_6m_pp > 0).sum()))
Sources and references
- Moody’s, Moody’s Seasoned Baa Corporate Bond Yield [BAA] and Moody’s Seasoned Aaa Corporate Bond Yield [AAA], retrieved from FRED, Federal Reserve Bank of St. Louis, October 9, 2026. Copyrighted, citation required.
- Moody’s, Moody’s Seasoned Baa Corporate Bond Yield Relative to Yield on 10-Year Treasury Constant Maturity [BAA10Y], daily, retrieved from FRED, Federal Reserve Bank of St. Louis, October 9, 2026. Copyrighted, citation required.
- Board of Governors of the Federal Reserve System, H.15 Selected Interest Rates, 10-Year Treasury Constant Maturity [GS10, DGS10], retrieved from FRED. Public domain.
- Kenneth R. French Data Library, Fama/French 3 Factors, monthly and daily, Tuck School of Business at Dartmouth, retrieved October 9, 2026.
- Merton, R. C., “On the Pricing of Corporate Debt: The Risk Structure of Interest Rates”, Journal of Finance, 29(2), 449–470, 1974, doi:10.2307/2978814.
- Gilchrist, S. and Zakrajšek, E., “Credit Spreads and Business Cycle Fluctuations”, American Economic Review, 102(4), 1692–1720, 2012, doi:10.1257/aer.102.4.1692.
- Fama, E. F. and French, K. R., “Common risk factors in the returns on stocks and bonds”, Journal of Financial Economics, 33(1), 3–56, 1993, doi:10.1016/0304-405X(93)90023-5.
- Künsch, H. R., “The Jackknife and the Bootstrap for General Stationary Observations”, Annals of Statistics, 17(3), 1217–1241, 1989, doi:10.1214/aos/1176347265.
Limitations
- Monthly averages. Moody’s monthly series and GS10 are averages of daily values, which smooth the spread and shift part of each month’s move into the next month’s change. The month-end and weekly BAA10Y controls address the timing; they cover 1986 onward only.
- Index composition. The Baa index is built from seasoned bonds with maturities of 20 years and above, and its constituents change over a century; the 10-year Treasury is shorter, so Baa minus Treasury mixes credit and curve. Baa minus Aaa holds maturity constant and is published next to it.
- Peaks are known after the fact. A peak is dated only once the 15% decline has happened. The test describes the state of the spread at peaks; it is not a rule that could have been applied in real time.
- Twelve observations. Twelve peaks since 1954, fourteen since 1926: every count here is small, and the circular shift is reported for that reason.
- Ex-post coefficient. The rate-adjusted variant uses a slope estimated on the whole sample; a slope estimated in real time would differ.
- Overlapping windows and data ends. Forward returns and six-month changes overlap from one month to the next. The French library ends in August 2026, so September 2026 has spread data and no market return.
Frequently asked questions
Do credit spreads widen before stock market peaks?
On Moody’s Baa record since 1953, no more often than in an ordinary month. At the 12 US stock-market peaks followed by a decline of 15% or more since 1954, Moody’s Baa minus 10-year Treasury spread stood 25 basis points or more above its 12-month low in the peak month at 4, against 47.0% of all 869 months and 39.1% of the months in which the market closed at a high. A circular shift of the same flag series gives 4 or fewer 25.9% of the time. Counting the flag in any of the 12 months up to the peak raises the count to 9 of 12, and the base to 81.4%.
What happens to corporate bond spreads after a stock market peak?
On the Baa record they have usually widened. Six months after 9 of the 12 peaks since 1954 the Baa minus 10-year Treasury spread was wider than in the peak month, and Baa minus Aaa gives the same nine, against 44.4% and 43.1% of all months; the median change was +0.32 point, against −0.04 for all months. The largest move followed October 2007, +1.34 point. The exceptions are November 1968, December 1972 and November 1980.
Is the Baa spread a high-yield spread?
No. Baa is Moody’s lowest investment-grade rating category, the one just above high yield, and the Moody’s Baa index on FRED averages seasoned bonds with maturities of 20 years and above. The test uses that index, which FRED carries back to 1919, and says nothing about high-yield bonds, leveraged loans or credit default swaps. Its length is what allows 12 peaks since 1954 and 14 since 1926.
Why did an earlier count find credit turning first at most peaks?
Because of how the count was built. The rule looked for the lowest spread in a window ending at each stock-market peak and measured the gap between the two dates. Applied to the Baa spread with a 24-month window, it finds the low ahead of the peak at 12 of 12 peaks, with a median gap of 11.0 months. Applied to 2,000 random walks with no link to stocks, it finds one at 10.6 of 12 peaks on average, with a median gap of 11.5 months, and 22% of the random walks match or beat the Baa count. A low taken from a window that ends at the peak sits ahead of the peak whatever the series.
Is the Baa minus Treasury spread just tracking the 10-year Treasury yield?
In part. Since 1953 each point of rise in the 10-year yield has come with a fall of 0.43 point in the monthly spread, a correlation of −0.624 on 881 monthly changes. With that component removed, the spread was widening at 5 of 12 peaks against 36.7% of months, above its base, the opposite side from the unadjusted count; the result is not distinguishable from chance (0.467 on a binomial test). Baa minus Aaa, which holds maturity constant, flags 1 of 12 peaks against 26.4% of months. Six months after the peak both Baa minus Treasury and Baa minus Aaa were wider at 9 of 12.
Can I reuse the monthly file?
The file can be downloaded and cited, under its producers’ terms. Moody’s yields, BAA, AAA and BAA10Y, are copyrighted and published by FRED with a citation requirement, so the file is not released under an open licence: cite Moody’s and FRED for those columns, the Board of Governors for the Treasury yield and the Kenneth R. French Data Library for market returns. The flags, peak dates and forward columns are Eco3min Research calculations. Eco3min text and analysis are CC BY 4.0; Eco3min grants no licence over third-party data.
Cite this page
Eco3min Research, “Baa credit spread vs stock market peaks, 1953–2026: widening at 4 of 12 tops, wider at 9 six months on”, October 2026. https://eco3min.fr/en/baa-credit-spread-vs-stock-market-peaks/ Data: Moody’s via FRED, citation required; Kenneth R. French Data Library.
Last updated — 9 October 2026
Disclaimer – Financial and Legal Information: The analyses, commentary, and content published on eco3min.fr are provided for informational and educational purposes only. They do not constitute investment advice or a solicitation to buy or sell financial instruments. Past performance is not indicative of future results. All investment decisions involve risk and are the sole responsibility of the reader. Data, charts and calculated series are provided as is and may contain errors or lag behind their source: check any figure against the primary source cited before relying on it. Content describing laws, regulations or contracts reflects the law as of its publication date and does not constitute legal or tax advice; applying it to a specific situation requires a qualified legal or tax professional.