
How Americans Pay Cash, by Age and Purchase Size
How Americans pay cash
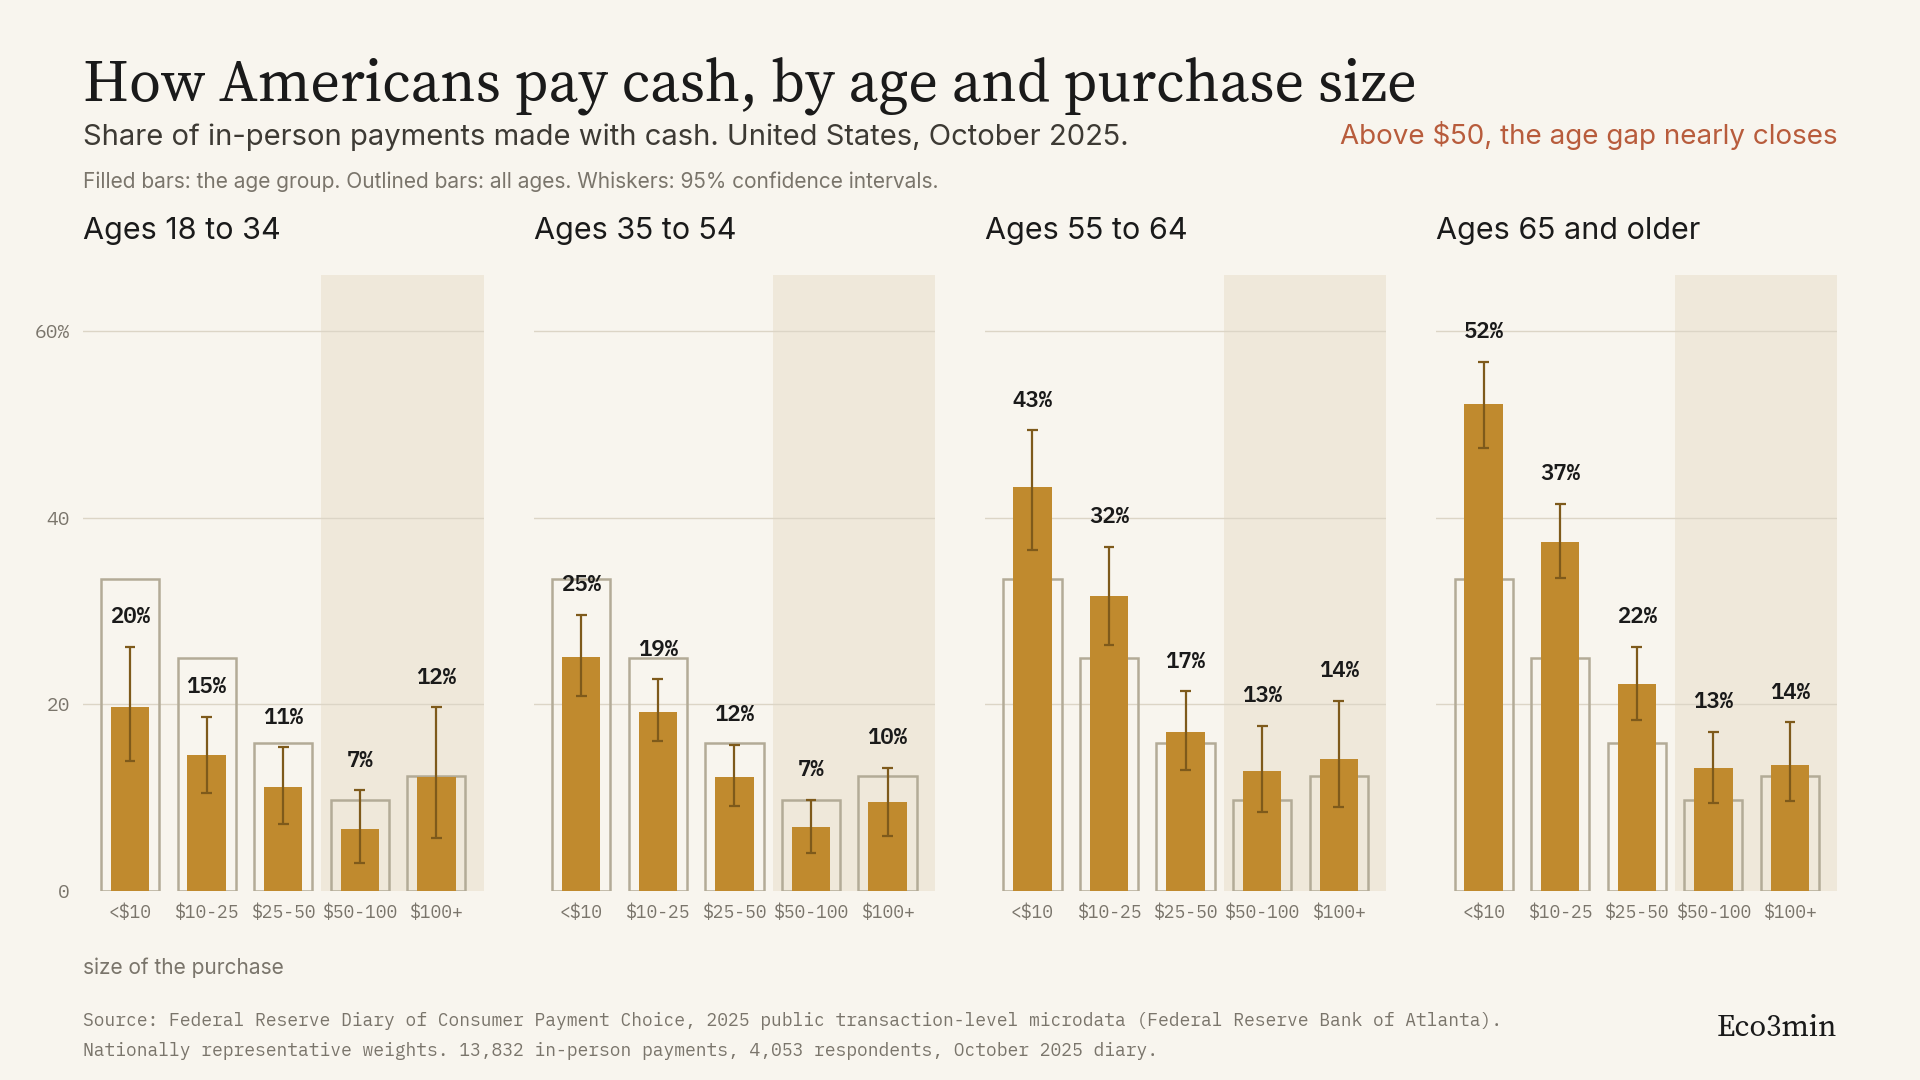
Share of in-person payments made with cash. United States, October 2025.
Each group of bars is a purchase size. Within it, the four bars are age groups, youngest to oldest.
In the United States, the age gap in cash use is almost entirely a small-purchase gap. Below $10, people aged 65 and older pay cash for 52.2% of their in-person payments, against 19.7% for people aged 18 to 34. Above $100, the two groups sit at 13.5% and 12.2%, a difference of 1.3 percentage points. The generational divide that dominates commentary about cash is real, and it lives almost entirely in transactions worth less than $25.
This page documents where cash still gets used in American retail, using the Federal Reserve’s own transaction-level microdata rather than the summary tables. Every figure below is recomputed from the public 2025 Diary of Consumer Payment Choice file. Payment habits are a small but daily piece of financial education, from inflation and interest rates to money decisions.
Key Findings at a Glance
Universe: in-person payments reported during the October 2025 three-day diary
Sample used: 13,832 in-person payments from 4,053 respondents in the nationally representative sample
Cash share of all consumer payments: 13.9%
Cash share of in-person payments: 21.4%
Cash share below $10, all ages: 33.4%
Cash share between $50 and $100, all ages: 9.8%
Below $10, ages 65 and older: 52.2% (95% confidence interval 47.5 to 56.7)
Below $10, ages 18 to 34: 19.7% (95% confidence interval 13.9 to 26.2)
Age gap below $10: 32.5 percentage points
Age gap above $100: 1.3 percentage points
Share of in-person cash payments below $25: 70.4%
Highest cash share by destination: payments to another person (gifts, repayments, small jobs), 62.8%
All figures are Eco3min calculations from the public transaction-level file of the Federal Reserve Diary of Consumer Payment Choice, using the nationally representative day-of-week weights. Confidence intervals are bootstrapped with 1,000 replications, clustered on the respondent.
What the commentary says, and what it gets right
The dominant account of American cash use has two parts, and both are supported by the published record. The first is that cash has become a minority instrument: in 2025 it accounted for roughly one in seven consumer payments, ranking third behind credit and debit cards for the sixth consecutive year, according to the Federal Reserve’s 2026 Diary report. The second is that cash use is stratified by age: the same report finds that consumers aged 55 and older made about ten cash payments per month, against two for consumers under 25.
Neither claim is wrong. Recomputed from the microdata, cash accounts for 13.9% of all consumer payments and 21.4% of in-person payments, and the gradient by age is unambiguous. The question this page asks is narrower: where in the distribution of transactions does that age gradient actually live?
The gap is a small-purchase gap
Sorting every in-person payment by size and computing the cash share within each band changes the picture. For the population as a whole, the cash share falls from 33.4% below $10 to 25.0% between $10 and $25, 15.9% between $25 and $50, and 9.8% between $50 and $100. Splitting the same grid by age shows that the entire generational spread is concentrated at the left end of that distribution.
Below $10, the spread between the oldest and youngest groups is 32.5 percentage points, a ratio of about 2.7 to 1. Between $10 and $25 it is 22.8 points. Between $25 and $50 it narrows to 11.0 points. Between $50 and $100 it is 6.6 points, and above $100 it is 1.3 points. In level terms the convergence is sharper still: above $50, no age group in the sample pays cash more than 15% of the time. Card or banknote at that ticket size is one of the everyday financial decisions that shift with the economic regime.
Read the other way, the same data says that older Americans have not maintained a general preference for cash across their spending. Their cash use falls with purchase size exactly as everyone else’s does, from 52.2% below $10 to 13.2% between $50 and $100, a decline of 39.0 points. What separates them from younger consumers is not a different attitude to payment across the board, but a much higher propensity to reach for cash on the smallest transactions.
Two readings of the same gradient
The data used here are age bands measured at a single point in time, not birth cohorts followed across their lives. That distinction carries the whole interpretive weight of the result, and it admits two readings that the data cannot separate.
The cohort reading. Consumers who came of age with contactless cards and phone wallets never built a cash habit for small purchases, and they will carry that absence forward as they age. On this reading, the 52.2% observed among today’s over-65s is a residue of a payment culture that will not be replaced, and the aggregate cash share will keep declining as cohorts turn over. The Federal Reserve’s own decade of Diary data is consistent with this: the report notes that in 2016 cash accounted for roughly a third of payments regardless of the payer’s age, and that the differences by age and income widened over the following ten years.
The life-cycle reading. Cash use rises with age at every point in time because of things that come with age rather than with a generation: more time spent in cash-accepting settings, more discretionary liquidity carried on the person, different exposure to merchants that discount for cash, and different tolerance for card-based tracking. On this reading, today’s under-35s will drift toward higher cash use as they age, and the aggregate share will stabilise rather than decline further.
Both readings predict the observed 2025 cross-section. Separating them requires following the same individuals over time, which the Diary’s annual repeated cross-section does not do. The persistence result the Federal Reserve does report is that more than 90% of consumers state no plan to stop using cash, and that share has been stable in recent years. That is a statement about intentions, not about future behaviour.
Where cash goes when the amount is large
One feature of the distribution runs against the general pattern. In three of the four age groups the cash share stops falling above $100 and edges back up: from 6.6% to 12.2% for ages 18 to 34, from 6.9% to 9.5% for ages 35 to 54, and from 12.9% to 14.2% for ages 55 to 64. The mechanism is compositional rather than behavioural. Above $100, the set of transactions changes: retail purchases give way to payments made directly to another person.
Computing the cash share by type of recipient across all purchase sizes makes the point directly.
| Type of recipient | Cash share of in-person payments | Payments observed |
|---|---|---|
| Another person: gifts, repayments, small jobs | 62.8% | 506 |
| Charitable and religious donations | 57.1% | 235 |
| Arts, entertainment, recreation | 37.1% | 271 |
| General services (hairdressers, repairs, parking, laundry) | 31.6% | 498 |
| Fast food, coffee shops, food trucks | 24.8% | 2,416 |
| Sit-down restaurants and bars | 22.2% | 1,195 |
| Gas stations | 16.3% | 1,538 |
| General merchandise and department stores | 16.0% | 2,054 |
| Groceries, convenience stores, pharmacies | 15.6% | 3,854 |
| Public transport | 9.1% | 291 |
| Health care | 8.2% | 276 |
Note: categories with fewer than 120 observed payments are omitted from this table. All purchase sizes and all ages combined. Source: Federal Reserve Diary of Consumer Payment Choice, 2025 public transaction-level microdata. Eco3min calculation.
Person-to-person payments carry by far the highest cash share of any category, and they are disproportionately large. Restricted to payments of $100 or more, payments to another person account for roughly a third of all cash payments in that range, and the cash share within the category is close to half. Rent and utility payments follow. The uptick above $100 is therefore not a return of cash to the checkout counter; it is the informal economy showing up in a dataset that is otherwise dominated by retail.
Counter-Arguments and Limitations
Four objections deserve to be stated plainly before the result is used.
First, the Diary is a three-day self-reported record collected in a single month. Respondents log every payment over three assigned days in October, chosen by the Federal Reserve to minimise seasonal effects. Three days is short and October is not December. The Diary codebook also documents diary fatigue, a decline in reported payments from day one to day three that the Federal Reserve mitigates by staggering the assigned diary windows across October without claiming to eliminate it. Under-recording affects the level of reported payments; it would bias the shares computed here only if it fell unequally on cash and cards, which the published documentation does not establish either way.
Second, these are age bands, not cohorts. This is the limitation that matters most, and it is why the section above presents two readings rather than one. No statement about what today’s under-35s will do at 70 is supportable from a single cross-section.
Third, the analysis is restricted to in-person payments. Cash cannot be used remotely, so including online and telephone payments would mechanically depress every cash share without telling you anything about payment choice at the point of sale. The Federal Reserve’s own report makes the same restriction. The consequence is that the headline figures here are higher than the commonly cited 14%, which is computed over all payments.
Fourth, the cells thin out at the extremes. The 18 to 34 band above $100 rests on 127 observed payments and carries a confidence interval running from 5.7% to 19.7%. The merchant breakdown within the $100 and above range rests on fewer than 70 payments in several categories, which is why those figures are described here in approximate terms rather than to one decimal. The full cell counts and intervals can be recomputed from the Diary microdata, so that any reader can judge which comparisons the sample supports.
Common Misinterpretations
Reading this as evidence that cash is disappearing. The direction of travel is not in dispute, but nothing here measures it. This is a single cross-section. What it establishes is where cash is still concentrated, not how fast that concentration is eroding. The Federal Reserve’s decade series is the appropriate source for the trend, and it shows cash use broadly stable over the last three years after the decline that accompanied the pandemic.
Reading the age gradient as a statement about preference. The Diary asks separately about preferred payment method, and preference and behaviour do not coincide. The Federal Reserve reports that only 16% of consumers name cash as their preferred in-person method, while about 70% of in-person cash payments come from people who prefer something else. Cash functions as a fallback for a large share of the people using it, which is a different phenomenon from attachment.
Reading the rise above $100 as retail behaviour. It is not. As documented above, the composition of transactions changes at that end of the distribution, and person-to-person payments drive the result.
Treating “five out of six cash payments are under $25” as equivalent to the figure here. The Federal Reserve’s 2026 report describes small-value cash use with that phrase, which reads as 83%. Recomputed from the microdata, 70.4% of in-person cash payments fall below $25, a figure stable across all three weighting schemes available in the file and on unweighted data. The difference is arithmetic rather than substantive: the published phrasing rounds an average of about 4.5 monthly cash payments under $25 out of about 6.5 total cash payments. Both statements describe the same underlying data.
Methodology and Sources
Primary source. Federal Reserve Diary of Consumer Payment Choice, 2025 wave, public transaction-level, day-level and individual-level files published by the Federal Reserve Bank of Atlanta. The Diary is a collaboration of the Federal Reserve Banks of Atlanta and Boston and Federal Reserve Financial Services, administered through the University of Southern California Understanding America Study panel. The 2025 wave was fielded in October 2025 with 6,079 participating individuals.
Construction. Transaction records are merged with day-level records on respondent identifier and diary date to attach the day-of-week weight, and with individual-level records to attach age. Transactions without a recorded payment instrument, without an amount, or outside the nationally representative sample are dropped. The analysis is then restricted to payments flagged as in-person. The resulting analytic sample is 13,832 payments from 4,053 respondents.
Weighting. All shares use the day-of-week weight, described in the Diary codebook as built to account for day-of-week effects in the number and value of payments and drawn from the nationally representative sample. Results were checked against the day-level weight and the individual weight; the cash share of in-person payments moves between 20.4% and 21.4% across the three, and no conclusion in this page depends on the choice.
Validation. Two published aggregates were used as controls. The cash share of all consumer payments recomputed here is 13.9%, against the 14% published in the Federal Reserve’s 2026 Diary report. The cash share of in-person payments recomputed here is 21.4%, against the “around 20%” stated in the same report.
Confidence intervals. Percentile bootstrap with 1,000 replications, resampling respondents rather than transactions so that intervals account for the clustering of multiple payments within one diary.
Bands and groups. Purchase size bands are left-closed: under $10, $10 to $24.99, $25 to $49.99, $50 to $99.99, $100 or more. Age groups are 18 to 34, 35 to 54, 55 to 64, and 65 and older. Merchant categories follow the Diary’s own 21-category coding, aggregated only by dropping categories with fewer than 120 observations.
Reproducibility. The complete grid, including every payment instrument, every band, every age group, confidence intervals, cell counts and respondent counts, can be rebuilt from the source files; the study file is not offered for download. The source files are public and downloadable from the Federal Reserve Bank of Atlanta.
Frequently Asked Questions
Because they are computed over in-person payments only. The 14% figure covers all consumer payments, including online purchases, automatic bill payments and transfers, none of which can be settled in cash. Over in-person payments alone the cash share is 21.4%. Both numbers are correct; they answer different questions.
Is the age gap statistically solid?
For small purchases, yes. Below $10 the confidence interval for ages 65 and older runs from 47.5% to 56.7%, and for ages 18 to 34 from 13.9% to 26.2%. The two do not overlap, and the same holds between $10 and $25 and between $25 and $50. Above $100 the intervals overlap heavily, which is consistent with the convergence described here rather than an obstacle to it.
Does this mean younger Americans never use cash?
No. Ages 18 to 34 still settle about one in five in-person payments under $10 in cash. The Federal Reserve reports that more than 80% of all consumers used cash at least once in the 30 days before being surveyed, a higher share than reported using credit cards or debit cards over the same window, because cash is widely held as a backup even by people who rarely choose it.
Because the mix of transactions changes. Payments to another person for gifts, repayments and small jobs carry a cash share of 62.8% across all sizes, and they make up a large part of the payments above $100. Rent and utility payments contribute as well. Within retail categories the cash share continues to fall as amounts rise.
Could the result be an artefact of where people live rather than how old they are?
Location is a real factor and it is not controlled for here. The Federal Reserve reports that rural residents made about nine cash payments per month in 2025 against six for urban and suburban residents, and that rural households prefer cash at a higher rate. Because the Diary reports the age gradient and the rural gradient separately, part of the difference documented here may reflect where respondents live rather than how old they are. The published figures do not allow that decomposition, and the dataset released with this page does not attempt it.
Can I reproduce these numbers?
Yes. The Diary microdata are available for download from the Federal Reserve Bank of Atlanta, the weighting variable is documented in the Diary codebook, and every band definition used here is stated in the methodology section above.
The study file is not offered for download: the reuse terms of the Diary of Consumer Payment Choice microdata (Federal Reserve Bank of Atlanta) could not be verified. The methodology lists every source.
Conclusion
Cash in the United States is not evenly distributed across the things Americans buy. It is concentrated at the bottom of the transaction-size distribution and in payments that go to another person rather than to a business. Within that structure, the difference between age groups is large where amounts are small and close to absent where they are large: 32.5 percentage points below $10, 1.3 points above $100.
What this implies about the future of cash depends on which of the two readings above is correct, and a single cross-section cannot decide between them. What it does establish is that the aggregate cash share, the number that gets quoted, is an average over a distribution whose shape carries most of the information. A payment system that stopped accepting cash would not affect all Americans equally, and it would not affect all transactions equally either.
The data and analysis presented on this page are provided for informational and educational purposes only. They do not constitute investment advice or a recommendation to take any specific action.
Last updated — 6 October 2026
Disclaimer – Financial and Legal Information: The analyses, commentary, and content published on eco3min.fr are provided for informational and educational purposes only. They do not constitute investment advice or a solicitation to buy or sell financial instruments. Past performance is not indicative of future results. All investment decisions involve risk and are the sole responsibility of the reader. Data, charts and calculated series are provided as is and may contain errors or lag behind their source: check any figure against the primary source cited before relying on it. Content describing laws, regulations or contracts reflects the law as of its publication date and does not constitute legal or tax advice; applying it to a specific situation requires a qualified legal or tax professional.