
Top Oil Producing Countries, Ranked Year by Year Since 1985
The US has led world crude oil production since 2018, at 13.7 million barrels a day in 2025, ahead of Russia and Saudi Arabia. EIA data, ranked year by year.
World crude output is concentrated in a few countries, and the order at the top has turned over repeatedly in four decades. Three producers now pump close to two barrels in five.
Below, the 2025 ranking; the slider rebuilds it for any year since 1985, from the same EIA series.
The United States has been the world’s top crude producer every year since 2018, at 13.66 million barrels a day (mb/d) in 2025, per EIA data.
- Russia (9.89 mb/d) and Saudi Arabia (9.55 mb/d) follow; the top three pumped 39.2% of world output.
- Saudi Arabia led for 17 of the 41 years since 1985, Russia for 9, the US for 8 and the Soviet Union for 7.
- Between 2018 and 2025 the US added 2.70 mb/d to its output, more than the rise in world output.
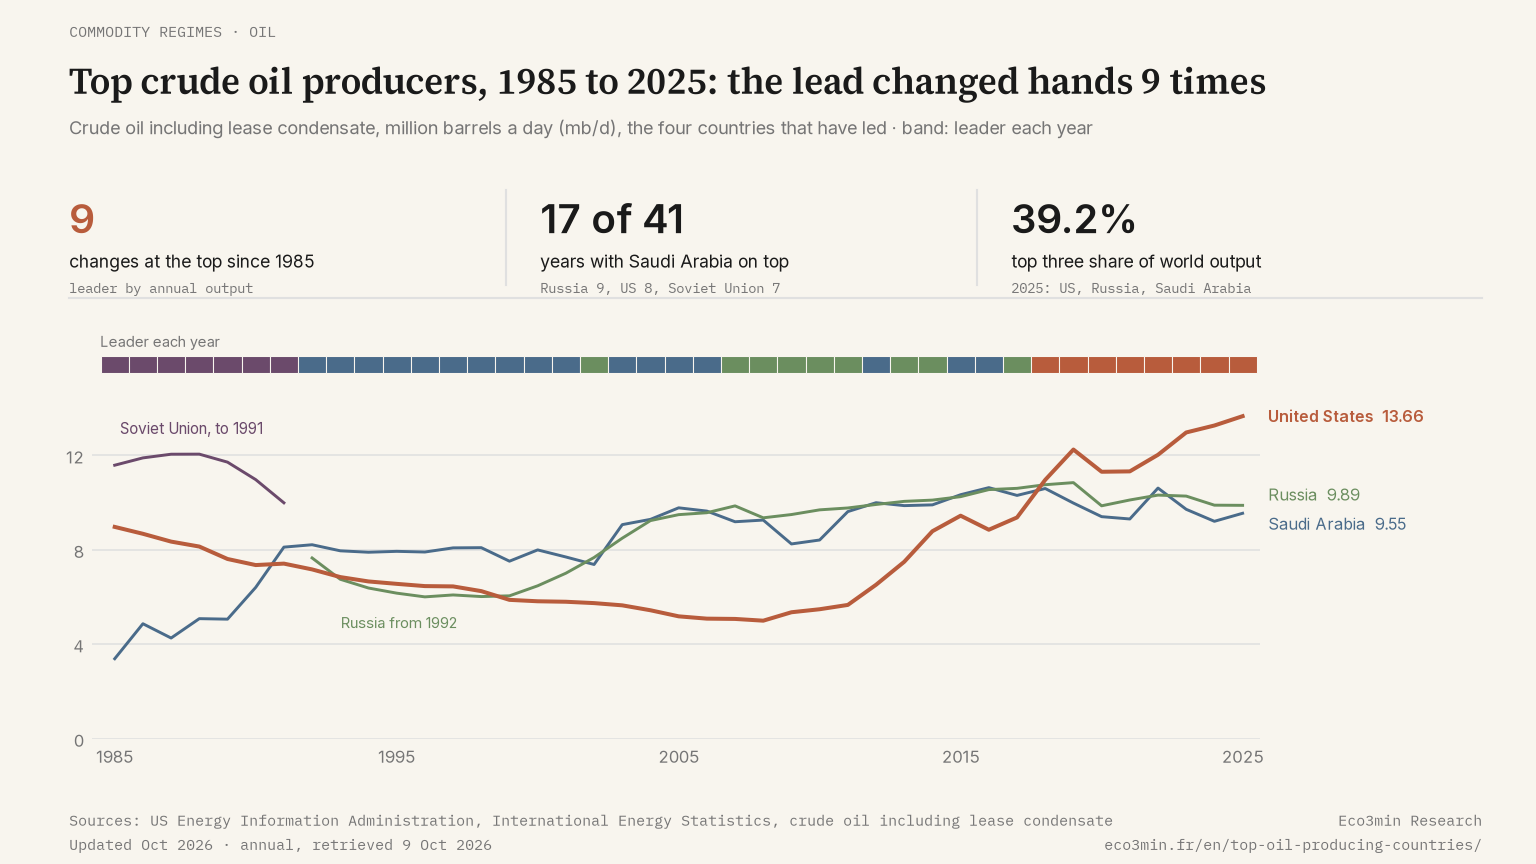
This page ranks crude oil including lease condensate, the definition used in EIA international energy data, for every country with data: 218 in 2025, for a world total of 84.46 mb/d. Saudi Arabia is often cited as the world’s largest producer. It last held the top spot in 2016. The United States has led every year since 2018, while the US Strategic Petroleum Reserve holds the country’s emergency crude. The top spot has changed hands 9 times since 1985, and the ten largest producers accounted for 72.2% of world output in 2025.
The 2025 ranking
| Rank | Country | Crude oil and condensate, kb/d | Share of world output |
|---|---|---|---|
| 1 | United States | 13,662 | 16.2% |
| 2 | Russia | 9,885 | 11.7% |
| 3 | Saudi Arabia | 9,549 | 11.3% |
| 4 | Canada | 4,964 | 5.9% |
| 5 | Iraq | 4,388 | 5.2% |
| 6 | China | 4,325 | 5.1% |
| 7 | Iran | 4,051 | 4.8% |
| 8 | United Arab Emirates | 3,771 | 4.5% |
| 9 | Brazil | 3,769 | 4.5% |
| 10 | Kuwait | 2,584 | 3.1% |
| 11 | Kazakhstan | 2,047 | 2.4% |
| 12 | Norway | 1,858 | 2.2% |
| 13 | Mexico | 1,726 | 2.0% |
| 14 | Nigeria | 1,605 | 1.9% |
| 15 | Libya | 1,363 | 1.6% |
The list thins quickly below the top three. Canada, fourth, pumped about half as much as Saudi Arabia, and Libya, fifteenth, 1.36 mb/d. Canada, China and Brazil all set national records in 2025, producing more than in any earlier year of the series. Canada’s fourth place is also its best rank.
The ranking for any year since 1985
Move the slider to an earlier year and the fifteen largest producers are ranked again from that year’s data, with each country’s output and share of the world total. Pin a country to keep it on screen when it falls outside the top fifteen.
The default view shows 2025 with Venezuela pinned. It ranked 6th in 1997, at 3.18 mb/d, its highest output of the period, and 20th in 2025 at 973,000 barrels a day. Its output fell by more than two thirds. The United Kingdom traces a different arc: 5th in 1985, a North Sea peak of 2.70 mb/d in 1999, 24th in 2025.
The slider starts in 1985 for a reason. Before that year the EIA series covers only 24 countries, leaving out producers such as Indonesia and Brazil, and it has no Soviet figure for 1984, so a full ranking cannot be rebuilt. The leading positions of the 1970s are still readable: the United States, with 9.21 mb/d in 1973, was ahead of the Soviet Union at 8.32 mb/d, which then led from 1974 to 1983.
Nine changes at the top since 1985
Leading producer each year, 1985 to 2025:
- 1985–1991, the Soviet Union
- 1992–2001, Saudi Arabia
- 2002, Russia
- 2003–2006, Saudi Arabia
- 2007–2011, Russia
- 2012, Saudi Arabia
- 2013–2014, Russia
- 2015–2016, Saudi Arabia
- 2017, Russia
- 2018–2025, the United States
Over these 41 years Saudi Arabia led most often, 17 years, ten of them in a row from 1992 to 2001. From 2002 to 2017 the lead passed between Saudi Arabia and Russia 7 times. The United States, still 3rd in 2017, has led every year since 2018.
The break of 1991 shows in the data. The Soviet Union produced 9.99 mb/d in its last year; Russia, counted separately from 1992, produced 7.66 mb/d that year, second behind Saudi Arabia.
Rankings that mix definitions mislead. On the EIA’s broader measure of total petroleum and other liquids, which adds natural gas liquids, biofuels and refinery gains, US output for 2025 is 23.73 mb/d and Saudi Arabia comes second, ahead of Russia. This page ranks crude oil and lease condensate only, the same definition for every country and every year.
Concentration has risen again since 1999
The top three’s share of world crude fell from 44.4% in 1985, when the Soviet Union alone produced 21.5%, to a low of 30.2% in 1999, as output spread across more countries. It climbed back to 39.2% in 2025 with the US surge. The top ten followed the same path, from 71.9% in 1985 to 62.3% in 1999 and 72.2% in 2025. Below the top, the field has thinned since 2010: 21 countries pumped at least 1 mb/d that year and 19 in 2025, while those above 2 mb/d went from 13 to 11.
Risers and fallers
Mexico ranked 4th in 1985 and peaked at 3.38 mb/d in 2004, and was 13th in 2025. Norway, 6th in 1995, was 12th. Iran, at 4.05 mb/d in 2025, stayed below its 2017 level of 4.45 mb/d.
Brazil moved the other way, from 1.23 mb/d in 2000 to 3.77 mb/d in 2025, in 9th place. Guyana, with no recorded output in 2015, ranked 22nd in 2025 at 747,000 barrels a day. Kazakhstan, a separate entry only since 1992, climbed to 11th with 2.05 mb/d, its own record.
Where the growth came from, 2018 to 2025
Between 2018 and 2025 world crude output rose by 1.53 mb/d. The United States alone added 2.70 mb/d, more than the world total. Brazil (1.18 mb/d), Guyana (747,000 barrels a day) and Canada (621,000 barrels a day) came next. Saudi Arabia and Russia produced less, by 1.05 mb/d and 873,000 barrels a day, and Angola by 554,000 barrels a day. The top three’s share barely moved. It was 39.0% in 2018 and 39.2% in 2025, as American gains offset Saudi and Russian declines. The net gain came from the Americas. None of the four largest contributors belongs to OPEC.
Method and limits
Figures are the EIA’s annual estimates of crude oil including lease condensate (product 57). The Soviet Union is one entry until 1991; from 1992 Russia, Kazakhstan, Azerbaijan and the other successor states appear separately. The EIA publishes these international series monthly and annually and revises past values as national sources report.
A ranking by output says nothing about reserves, export capacity or the spare capacity some producers keep in hand, and it records what was pumped, not what could have been. It also ignores quality: a barrel of light condensate and a barrel of heavy crude count the same. Where those resources sit is mapped in markets for oil, gas and critical minerals, and the price differences that follow from quality and location are traced in the WTI–Brent spread since 1987.
Last updated — 9 October 2026
Disclaimer – Financial and Legal Information: The analyses, commentary, and content published on eco3min.fr are provided for informational and educational purposes only. They do not constitute investment advice or a solicitation to buy or sell financial instruments. Past performance is not indicative of future results. All investment decisions involve risk and are the sole responsibility of the reader. Data, charts and calculated series are provided as is and may contain errors or lag behind their source: check any figure against the primary source cited before relying on it. Content describing laws, regulations or contracts reflects the law as of its publication date and does not constitute legal or tax advice; applying it to a specific situation requires a qualified legal or tax professional.