
Crude oil in the US Strategic Petroleum Reserve, 1977 to 2026
Crude oil held in the US Strategic Petroleum Reserve
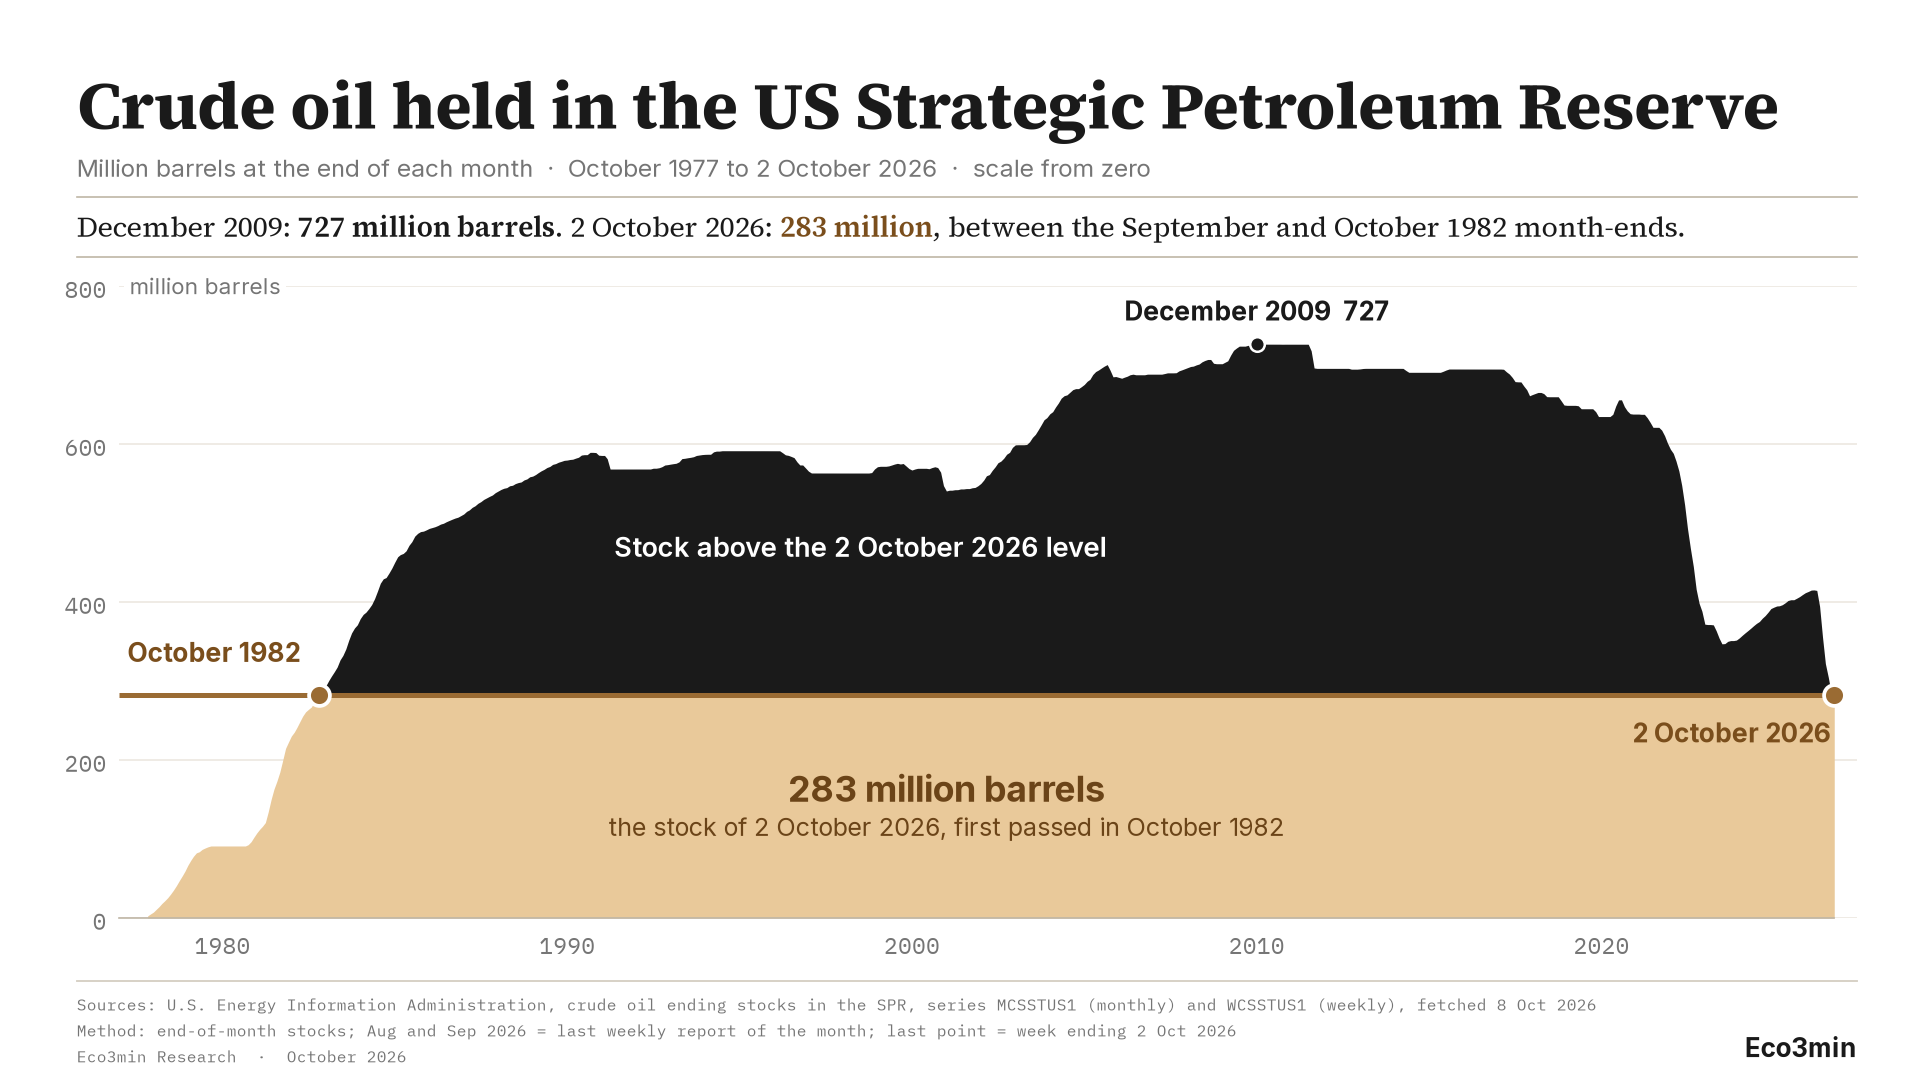
Million barrels at the end of each month, October 1977 to 2 October 2026. Switch the view: the stock, the barrels added or withdrawn each month, and every large drawdown since the first fill.
| Date | Stock | Share of the December 2009 peak |
|---|---|---|
| October 1977 | 2.6 | 0% |
| September 1982 | 277.9 | 38% |
| December 2009 | 726.6 | 100% |
| July 2020 | 656.1 | 90% |
| June 2023 | 347.2 | 48% |
| February 2026 | 415.4 | 57% |
| 2 October 2026 | 283.0 | 39% |
Source: U.S. Energy Information Administration, crude oil ending stocks in the Strategic Petroleum Reserve, series MCSSTUS1 (monthly) and WCSSTUS1 (weekly), fetched 8 October 2026.
Method: end-of-month stocks as published by EIA; August and September 2026 use the last weekly report of the month, and the last point is the week ending 2 October 2026. Nothing is interpolated. A drawdown runs from a previous high to the following low and is shown when it reaches 15 million barrels.
Commercial crude oil stocks, outside the reserve: US crude oil stocks dataset.
TL;DR. The US Strategic Petroleum Reserve held 283.0 million barrels of crude oil on 2 October 2026, less than at any month-end since September 1982.
- The stock peaked at 726.6 million barrels in December 2009. It now holds 39 percent of that peak, according to EIA data.
- Between February and early October 2026 it fell by 132.5 million barrels, a third of its level. May and June 2026 are the two largest monthly declines since 1977.
- The largest decline in volume remains the one from July 2020 to June 2023, 309.0 million barrels, which includes the 180 million barrels released by the Department of Energy in 2022.
The Strategic Petroleum Reserve, the federal government’s emergency stock of crude oil, held 283.0 million barrels in the week ending 2 October 2026, according to the weekly petroleum report of the U.S. Energy Information Administration. The reserve last held that little in the autumn of 1982, five years after it began to fill. This page follows the stock at the end of every month since October 1977, on one chart, from zero.
The chart splits the stock at today’s level: in ochre, the 283.0 million barrels the reserve holds now, a level it first passed in October 1982; in black, everything it held above that level since. The dataset behind it, 589 rows of EIA values with the month-on-month change, is available for download below.
Key figures at a glance
Scope: crude oil held in the US Strategic Petroleum Reserve, end of each month, October 1977 to 2 October 2026
Latest: 283.0 million barrels in the week ending 2 October 2026, 39% of the peak
Peak: 726.6 million barrels, December 2009
Same level as: September to October 1982 (277.9 and 284.6 million barrels at month-end)
2026 so far: 415.4 million barrels in February, minus 132.5 million by 2 October
Largest monthly declines: May 2026 (minus 39.1 million), June 2026 (minus 33.2 million), June 2022 (minus 29.8 million)
Sources: U.S. Energy Information Administration, crude oil ending stocks in the SPR, series MCSSTUS1 (monthly) and WCSSTUS1 (weekly), fetched 8 October 2026. Eco3min calculation of the changes and shares.
An emergency stock, measured in barrels
The reserve was created by the Energy Policy and Conservation Act of 1975, after the oil embargo of 1973. It stores government-owned crude oil that can be sold, lent or exchanged when supply is disrupted. EIA publishes its level twice: every Wednesday for the week ending the previous Friday, and in the Petroleum Supply Monthly for the end of each month, about two months later.
The chart uses the monthly series from October 1977, when it starts at 2.6 million barrels, to July 2026, the last month published on 30 September. August and September 2026 are taken from the last weekly report of each month, and the final point is the latest weekly report. The two series agree closely where they overlap: the median gap between a month-end value and the last weekly report of the same month is 72,000 barrels.
Thirty-two years of filling
The fill was fast at first. The stock reached 277.9 million barrels at the end of September 1982, 493.3 million at the end of 1985 and 591.7 million at the end of 1994. It then rose more slowly, to 700.7 million in August 2005 and to its peak of 726.6 million in December 2009. Over the same decades, the 1970 peak of annual US crude oil production stayed out of reach until 2018.
Small declines run through the whole history. The chart counts nine falls of 15 million barrels or more from a previous high. The Department of Energy’s history of releases lists, for example, 17.3 million barrels sold during the Gulf War in 1991 and 11.0 million barrels sold after Hurricane Katrina in 2005. The 1991 sale came after Iraq’s invasion of Kuwait had set off one of the oil shocks the US economy has absorbed since 1973. Between 2009 and 2020 the stock drifted down by 30 to 36 million barrels in each of three episodes, never far from its plateau.
Two large drawdowns, six years apart
The first large drawdown runs from July 2020, at 656.1 million barrels, to June 2023, at 347.2 million: a decline of 309.0 million barrels. It includes the 2022 release, in which, according to the Department of Energy’s history of SPR releases, “DOE released 180 million barrels of crude oil into the market”. Its largest month was June 2022, minus 29.8 million barrels. The stock then rose by 68.3 million barrels, to 415.4 million in February 2026.
The second drawdown began in March 2026. By 2 October the stock had lost 132.5 million barrels, 31.9 percent of its February level, in seven months. May 2026 (minus 39.1 million barrels) and June 2026 (minus 33.2 million) are the two largest monthly declines in the monthly series since 1977. The 2020 to 2023 episode was larger in volume. The 2026 episode was faster, and it took the stock lower. Created for a country that depended on imported oil, the reserve ran down both times in the years since 2020 in which the United States has been a net petroleum exporter.
What the stock does not say
The weekly figure counts the barrels in the caverns, not the barrels owed to them. A sale removes oil for good. An exchange lends it: in its notice of 29 September 2026, the Department of Energy sought bids for “an exchange of up to 40 million barrels of crude oil”, and states that companies “will return the 40 million borrowed barrels with additional premium barrels”. The same notice schedules deliveries out of the reserve under exchanges already awarded for November and December 2026, and gives no date for the returns. Two drawdowns of the same size can therefore leave the reserve in different positions a year later, and the stock series alone does not separate them.
The weekly report is the indicator to follow. A weekly level under 277.9 million barrels would take the stock below its September 1982 month-end, and a rise in the weekly figure would mark the point where returns start to exceed withdrawals. The monthly series confirms each month about two months later.
Two readings of the same series
One reading treats the chart as a reserve used for its purpose. The stock was built to be drawn when supply is disrupted, and the Department of Energy’s history of releases files its emergency sales of 1991, 2005 and 2022 under “Desert Storm”, “Hurricane Katrina” and an “IEA Coordinated Release”. On that view, a lower stock is what a buffer looks like after it has been used.
The other reading looks at what is left. At 283 million barrels the reserve holds 39 percent of its 2009 peak, after two drawdowns of more than 100 million barrels in six years, separated by a refill of 68.3 million barrels. Read that way, the chart shows a cushion smaller than at any month-end since September 1982, while the date of the next disruption is unknown. Against how much oil the US uses per day, that cushion comes to about two weeks of consumption.
Both readings use the same 589 values. The data do not say whether the barrels drawn in 2026 will come back, how many, or when. Nor do they describe the crude still in the ground: US proved oil reserves are a separate estimate, and the EIA leaves stored oil out of it.
Methodology and sources
Series. U.S. Energy Information Administration, U.S. Ending Stocks of Crude Oil in SPR, thousand barrels: MCSSTUS1, monthly, end of month, from October 1977; WCSSTUS1, weekly, week ending Friday, from August 1982. Both fetched from the EIA API on 8 October 2026.
Construction. One row per month from the monthly series up to its last published month (July 2026). For later months, the last weekly report dated in the month (28 August and 25 September 2026), then the latest weekly report (2 October 2026). Nothing is interpolated, spliced or rescaled. Where both series exist, the largest gap between a month-end value and the last weekly report of the same month is 6.8 million barrels and the median gap 72,000 barrels.
Derived values. Change = stock minus the stock of the previous row. Share of peak = stock divided by the December 2009 stock. A drawdown episode runs from a previous high to the following low, ends when the stock rebounds by more than 2 million barrels, and is counted when the decline reaches 15 million barrels. Changes and shares are computed in thousand barrels, then rounded, so a change can differ by 0.1 from the difference of two rounded stocks.
Limitations. (1) The stock does not distinguish sales from exchanges and loans that are due to return. (2) Weekly figures are subject to revision in the monthly series. (3) The chart says nothing about the quality of the crude held (sweet or sour) or about the condition of the storage sites. Their location, at least, is public: the reserve’s crude sits in four salt-cavern sites in Texas and Louisiana.
Reproducibility. The CSV below carries every row with its EIA series, frequency, stock in thousand and million barrels, change, phase label and share of peak. It is built by script from the EIA API; no value is typed in. The chart is produced with Python (matplotlib). Commercial crude oil stocks, held by companies outside the reserve, are covered in the US crude oil stocks dataset.
Common misinterpretations
Reading the stock as the lowest ever. The reserve started from zero in 1977. Today’s level is the lowest since 1982, and every month before October 1982 was lower.
Treating every drawdown as a sale. Exchanges and loans also lower the stock, and they are due to come back with additional barrels. The series records the barrels in storage, whatever the operation.
Taking the weekly figure as final. The monthly series, published about two months later, is the reference; the weekly figures used for August, September and early October 2026 may be revised.
Frequently asked questions
How much oil is in the Strategic Petroleum Reserve?
283.0 million barrels in the week ending 2 October 2026, according to EIA’s weekly petroleum report (series WCSSTUS1).
When was the Strategic Petroleum Reserve at its highest?
In December 2009, at 726.6 million barrels at month-end, according to EIA’s monthly series MCSSTUS1.
Is the reserve at its lowest level ever?
No. It is at its lowest level since 1982. The reserve began filling in 1977, and the last month-end below today’s level was September 1982, at 277.9 million barrels.
How large was the 2022 release?
The Department of Energy states that it released 180 million barrels of crude oil in 2022. In the monthly series, the stock fell from 656.1 million barrels in July 2020 to 347.2 million in June 2023.
How fast has the reserve fallen in 2026?
By 132.5 million barrels between the end of February and 2 October 2026, from 415.4 to 283.0 million. The declines of May and June 2026, 39.1 and 33.2 million barrels, are the largest monthly declines since 1977.
What is the SPR used for?
To protect the US economy from severe interruptions in oil supply, according to the Department of Energy. Congress created the reserve in the Energy Policy and Conservation Act of 1975, after the 1973 oil embargo. The department gives it a second role: meeting US stockholding obligations under the International Energy Program, the treaty behind the International Energy Agency. The President decides each withdrawal. It takes the form of a sale or of an exchange, in which companies borrow barrels and return them with premium barrels.
How many times has the SPR been released?
The Department of Energy counts four emergency sales ordered by the President: 17.3 million barrels in 1991 (Operation Desert Storm), 11.0 million after Hurricane Katrina in 2005, 30.6 million in the 2011 IEA coordinated release and 180.0 million in 2022. Its history of SPR releases also lists three test sales (1985, 1990 and 2014) and 16 emergency exchanges between 1996 and 2025. The 172 million barrels announced on 11 March 2026 are an exchange, not a sale. By 29 September 2026, more than 133 million barrels had been awarded. The International Energy Agency counts collective actions by its members rather than US sales: six since 1974, the latest on 11 March 2026.
Which countries have strategic oil reserves?
Each of the 32 members of the International Energy Agency has an obligation to hold oil stocks equal to at least 90 days of the previous year’s net imports. Net exporters such as Canada, Mexico and Norway are exempt. The stocks belong to the state in the United States, and to an agency or to companies under a legal obligation elsewhere; France combines the two. In the European Union, Directive 2009/119/EC sets 90 days of net imports or 61 days of consumption, whichever is greater. Outside the IEA, India reports caverns holding 5.33 million tonnes, about 9.5 days of national demand. China states that it has built nine national oil reserve bases but publishes no volume.
Download the complete dataset
589 rows, October 1977 to 2 October 2026: crude oil held in the Strategic Petroleum Reserve in thousand and million barrels, the EIA series and frequency of each row, the change from the previous row, a fill or draw label and the share of the December 2009 peak.
Data: U.S. Energy Information Administration (U.S. government work, public domain). Eco3min text and analysis: CC BY 4.0. Data, files and charts remain subject to their producer’s terms, stated on each page; Eco3min grants no licence over third-party data.
Conclusion
The reserve took thirty-two years to reach 726.6 million barrels and holds 283.0 million today, its level of the autumn of 1982. Two drawdowns account for most of the distance: the larger one between 2020 and 2023, the faster one in 2026. Both took place after 2018, the year the United States moved to first place in the ranking of the world’s top crude oil producers.
The next weekly reports will show whether the stock goes on falling. Deliveries out of the reserve under the exchanges already awarded are scheduled for November and December 2026, the borrowed barrels are due back with premium barrels at dates the notice does not give, and a weekly level under 277.9 million barrels would take the stock below its September 1982 month-end.
Last updated — 9 October 2026
Disclaimer – Financial and Legal Information: The analyses, commentary, and content published on eco3min.fr are provided for informational and educational purposes only. They do not constitute investment advice or a solicitation to buy or sell financial instruments. Past performance is not indicative of future results. All investment decisions involve risk and are the sole responsibility of the reader. Data, charts and calculated series are provided as is and may contain errors or lag behind their source: check any figure against the primary source cited before relying on it. Content describing laws, regulations or contracts reflects the law as of its publication date and does not constitute legal or tax advice; applying it to a specific situation requires a qualified legal or tax professional.