
Beef prices vs chicken in the US, adjusted for inflation, 1980 to 2026
US ground beef, measured in chicken
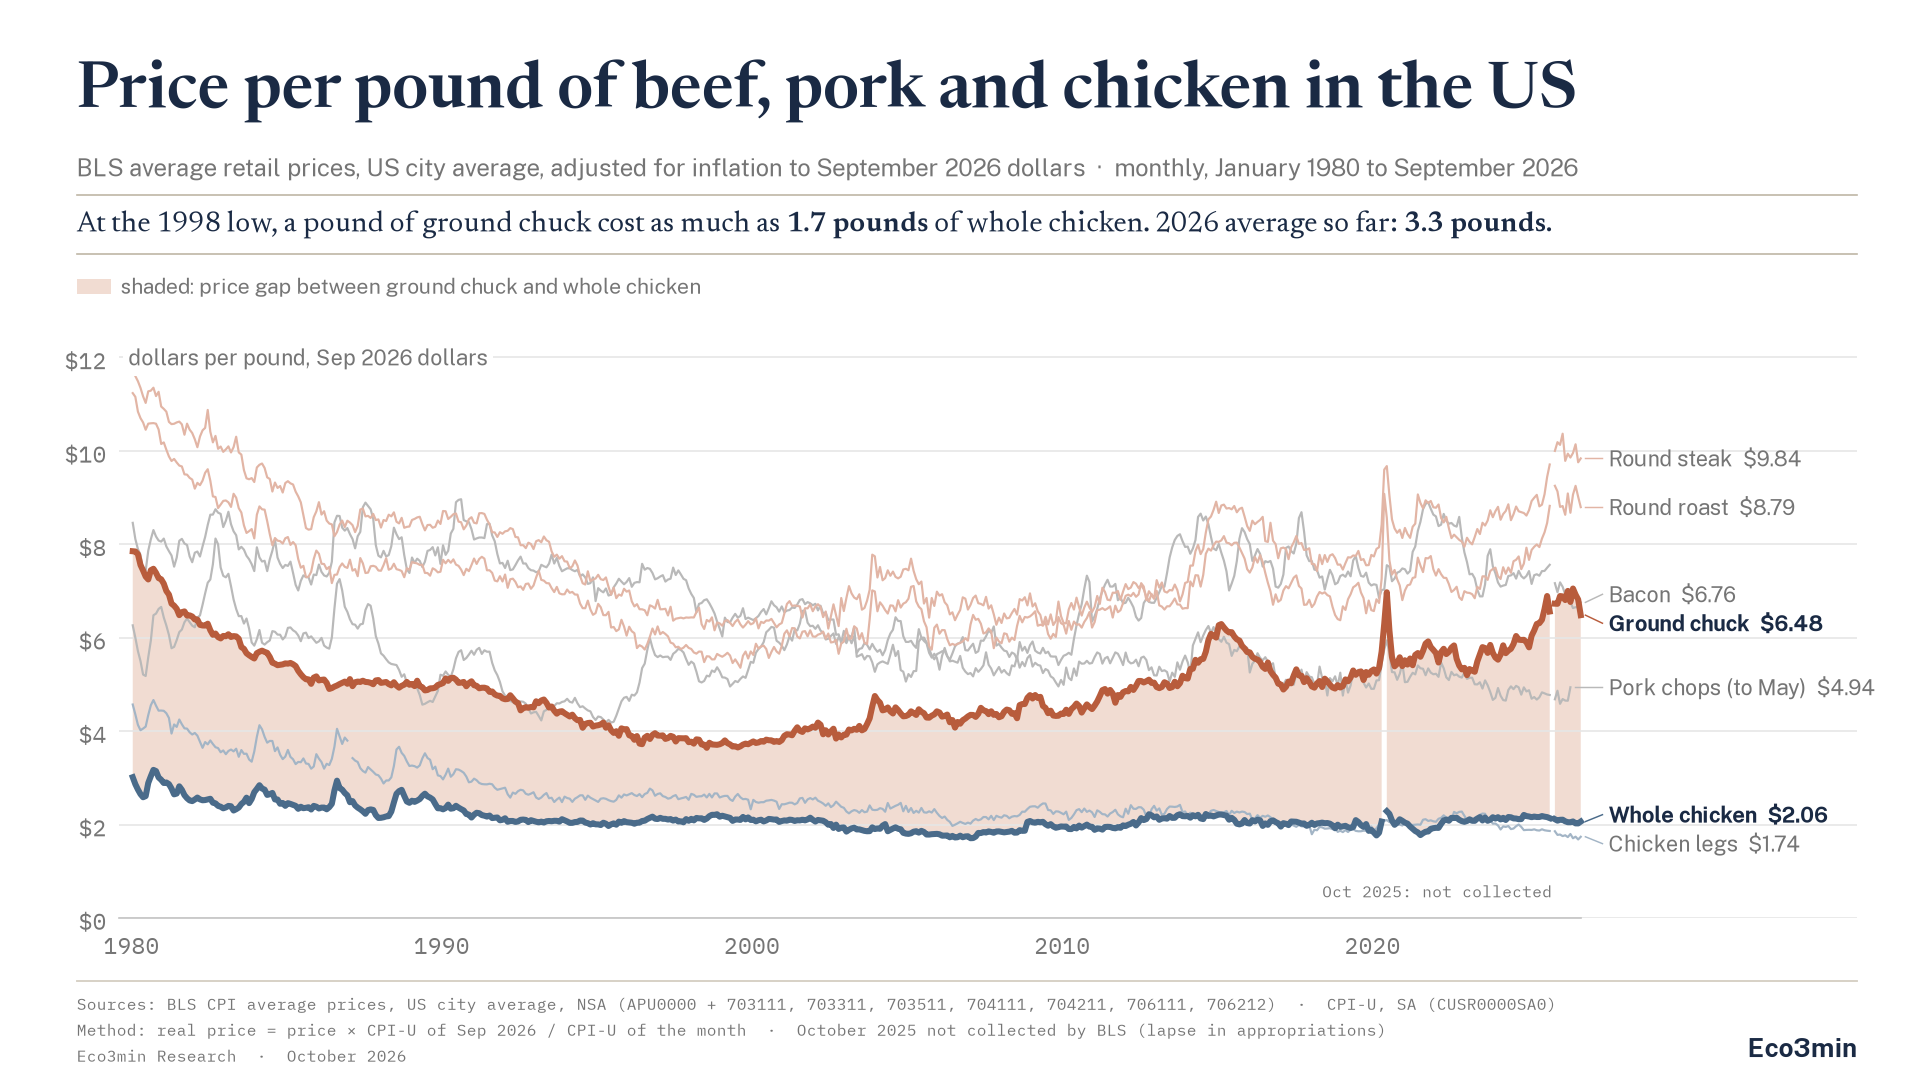
Average US retail price per pound, January 1980 to September 2026, in September 2026 dollars (CPI-U).
Each blue band is the price of one pound of whole chicken that month. The number of bands under the beef line is the price of beef in pounds of chicken.
TL;DR. In September 2026, a pound of ground chuck cost $6.48 in US cities and a pound of whole chicken $2.06: the beef was worth 3.14 pounds of chicken.
- Over 2026 so far, the average is 3.3 pounds. It was 1.7 in 1998, the lowest year since the series began in 1980, and no full year before 2026 reached 3.
- After inflation, chuck costs 9% less than in 1980 and whole chicken 29% less, in BLS average prices deflated by the CPI-U.
- In current dollars, chuck reached $6.98 in June 2026, the highest monthly price of a series that starts in 1980. In September 2026 dollars, it was the highest since January 1981.
A pound of ground chuck cost $6.48 in September 2026 and a pound of whole chicken $2.06, according to the average retail prices that the U.S. Bureau of Labor Statistics collects for the Consumer Price Index. So far in 2026, a pound of ground chuck has cost 3.3 pounds of chicken. The chart above follows both prices every month since January 1980, after inflation, and counts how many pounds of chicken a pound of beef is worth.
In the first view, each blue band is the price of one pound of whole chicken in the same month, stacked under the beef line. The second shows the ratio for three cuts of beef, the third the real price of seven cuts of beef, pork and chicken. The data behind them, 561 monthly rows, can be downloaded below.
Key figures at a glance
Scope: retail price per pound, US city average, seven cuts of beef, pork and chicken, monthly, January 1980 to September 2026
Latest: ground chuck $6.48, whole chicken $2.06, so 3.14 pounds of chicken per pound of beef (September 2026)
Lowest year: 1998, 1.73 pounds (chuck $3.73, chicken $2.15, in September 2026 dollars)
2026 so far: 3.32 pounds, January to September; highest full year before it: 2021, 2.98
Since 1980, after inflation: ground chuck down 9%, whole chicken down 29%
Sources: U.S. Bureau of Labor Statistics, average price series APU0000703111 (ground chuck) and APU0000706111 (whole chicken), five other cuts, and the CPI-U, series CUSR0000SA0, fetched 14 October 2026. Eco3min calculation of real prices and ratios.
Two prices from the same survey
Alongside the Consumer Price Index, BLS publishes the average retail price of defined food items across US cities. Two of them run from January 1980 to September 2026 almost without a gap (ground chuck misses one month, whole chicken two): “Ground chuck, 100% beef” and “Chicken, fresh, whole”, both per pound. Ground chuck is the only ground beef series that reaches 1980: regular ground beef starts in January 1984, lean ground beef in January 1991.
The dataset keeps every item of the BLS meat and poultry list that has a monthly series from January 1980 into 2026: seven out of 41. The bone-in chicken breast series stopped in October 2011, so whole chicken and chicken legs are the only chicken series that span the period.
Dollar prices are restated in September 2026 dollars with the CPI-U, the index of all items. The pounds of chicken need no such step. They divide two prices of the same month, so inflation cancels out.
Beef: a long fall, then a climb that stops short of 1980
In September 2026 dollars, ground chuck averaged $7.49 a pound in 1980. It fell for almost two decades, to $3.73 in 1998 and $3.72 in 1999, its lowest year, then rose. Over January to September 2026 it averaged $6.85, 83% above 1998 and higher than every year except 1980.
In current dollars, 2026 is a record: $6.98 in June 2026, the highest monthly price since the series began. After inflation, the record becomes a 45-year high. In September 2026 dollars, June 2026 ($7.05) was the dearest month since January 1981, and the 2026 average is still 9% under 1980.
Chicken: most of the fall came early
Whole chicken cost $2.89 a pound in 1980, in September 2026 dollars, and $2.06 over January to September 2026, 29% less. Since January 1990, its real monthly price has stayed between $1.71 (January 2007, the low of the whole series) and $2.43. Against 1998, it is 4% lower, almost unchanged.
Chicken legs, the other chicken series that goes back to 1980, fell further: 60% after inflation. Pork splits by cut. Center cut chops cost 41% less than in 1980 (the 2026 average runs to May, the last month BLS had published), sliced bacon 15% more.
Ground chuck also passed bacon. From April to August 2026, ground chuck cost more per pound than bacon every month. Before that run, the last month it did was May 1993. In September, bacon moved back above it. Over the whole series, chuck was the dearer of the two in 52 months out of 560.
Measured in chicken
Divide the two prices of the same month and the U becomes a ratio. A pound of chuck was worth 2.6 pounds of whole chicken in 1980, 1.7 in 1998 and 3.3 on average over January to September 2026. The monthly low is November 1998, at 1.67; the monthly high, July 2026, at 3.42.
No full year before 2026 reached 3. The closest was 2021, at 2.98. Round steak and round roast, the two other beef cuts tracked since 1980, draw the same U and stood at 4.8 and 4.3 pounds of chicken in September 2026. In dollars, the gap between chuck and chicken was $1.58 a pound in 1998, the narrowest year, and $4.79 in 2026, the widest.
The baseline changes the story. Against 1980, beef is cheaper and chicken far cheaper, so the whole rise of the ratio comes from chicken: priced in 1980 chicken, today’s chuck would be worth 2.37 pounds, fewer than in 1980. Against 1998, it is the other way round. Chicken barely moved and chuck rose 83%.
What the ratio leaves out
Each average price follows one defined item. A household that moved from chuck to chicken thighs, or from whole birds to boneless breast, appears in neither series, and the ratio says nothing about quantities bought. It is silent on causes as well: the retail series record prices only. The supply side of beef is followed on our page on the US cattle herd per person.
The ratio can also move from the chicken side. A rise in the price of chicken would make each band thicker, so fewer bands would fit under an unchanged beef line and the ratio would fall. The 1998 low came more from cheap beef than from dear chicken, although chicken played a part: in real terms, whole chicken cost more in 1998 than in any other year from 1992 to 2012. The pace of food price increases, as distinct from their level, is the subject of food prices: speed, not level.
The indicator to follow is the monthly ratio itself, published with each CPI release: APU0000703111 divided by APU0000706111. A monthly value below 2.98, the highest full year (2021), would bring it inside the range of every full year from 1980 to 2025. Single months had already reached 3 in 2020, 2021 and 2025.
Cheap chicken or dear beef
One reading starts from beef. The real price of chuck has risen 83% since 1998, its 2026 average is higher than every year except 1980, and the two other beef cuts follow it. On that view, more bands fit under the beef line because beef has climbed back toward its early-1980s level.
The other reading starts from chicken. Its real price has stayed inside a narrow band since 1990, and against 1980 the whole rise of the ratio comes from it. On that view, 2026 is the year in which beef, without reaching a new real high, met a chicken price that had stopped falling decades ago. The data hold both readings and do not say which price moves next.
Methodology and sources
Series. U.S. Bureau of Labor Statistics, average price data, US city average, not seasonally adjusted, dollars per pound (453.6 g), fetched from the BLS public API on 14 October 2026.
- APU0000703111, ground chuck, 100% beef
- APU0000703311, round roast, USDA Choice, boneless
- APU0000703511, round steak, USDA Choice, boneless
- APU0000704111, bacon, sliced
- APU0000704211, pork chops, center cut, bone-in
- APU0000706111, chicken, fresh, whole
- APU0000706212, chicken legs, bone-in
- Deflator: CUSR0000SA0, CPI-U, all items, seasonally adjusted
Construction. Real price = price of the month × CPI-U of September 2026 / CPI-U of the month. Pounds of chicken = price of the cut / price of whole chicken, same month, nominal over nominal. Annual values are calendar-year means of the real monthly prices present; the annual ratio divides the mean real price of the cut by the mean real price of whole chicken over the months where both are published. 2026 covers 9 months.
Missing months. October 2025 for every series: “BLS did not collect CPI data from October 1, 2025, through November 12, 2025”, according to the BLS note on the 2025 shutdown. May 2020 for whole chicken and January 1987 for chicken legs, not published. Pork chops after May 2026, not published at the fetch date. The lines keep the gaps; in the first view and on the chart posted to Reddit, the bands bridge each isolated missing month with the mean of the two neighbouring months. The CSV is not interpolated.
Set. Of the 41 meat and poultry items in the BLS item list, the seven with a monthly series from January 1980 into 2026. The exclusions that bear on the comparison, the other ground beef items and chicken breast, are explained above.
Limitations. (1) One defined item per series: no substitution between cuts. (2) An average across US cities: regional prices differ. (3) The CPI-U covers all items. A food index would move the dollar levels and leave the pounds of chicken unchanged.
Reproducibility. The CSV files below are built by script from the BLS API; no value is typed in. The chart is produced with Python (matplotlib), the interactive version in plain SVG. To measure prices in hours of work rather than dollars, see the US work hours price calculator.
Common misinterpretations
Reading the dollar axis as the price paid at the time. Every dollar figure is in September 2026 dollars. In current dollars, chuck cost less than two dollars a pound in 1980.
Treating the ratio as an inflation-adjusted figure. It needs no adjustment: both prices come from the same month, and general inflation cancels out.
Taking ground chuck for all beef. It is one cut. Round steak and round roast cost more pounds of chicken (4.8 and 4.3 in September 2026) and follow the same U.
Frequently asked questions
How much does a pound of ground beef cost in the US?
Ground chuck, 100% beef, cost $6.48 a pound in September 2026, US city average, according to BLS series APU0000703111. BLS also publishes other ground beef items, which start after 1980.
Are beef prices at a record high?
In current dollars, yes for ground chuck: $6.98 in June 2026, the highest monthly price since the series began in 1980. After inflation, no: June 2026 was the highest month since January 1981, and the 2026 average is 9% under 1980.
How many pounds of chicken does a pound of beef cost?
3.3 pounds of whole chicken per pound of ground chuck on average over January to September 2026, and 3.14 in September 2026. The lowest year was 1998, at 1.7; in 1980 it was 2.6.
Has chicken become cheaper?
After inflation, yes: whole chicken cost $2.89 a pound in 1980 in September 2026 dollars and $2.06 in 2026, 29% less. In yearly averages, 86% of the decline from 1980 to 2026 (January to September) had happened by 1991.
Why does the chart start in 1980?
January 1980 is the first month of the BLS average price series for these items. The dataset keeps the seven meat and poultry items whose monthly series runs from then into 2026.
Download the complete dataset
Monthly file: 561 rows, January 1980 to September 2026, nominal and real prices of the seven cuts, the CPI-U and the pounds of whole chicken per pound of each beef cut. Annual file: 47 rows, yearly means and ratios.
Download monthly CSVDownload annual CSV
Source: U.S. Bureau of Labor Statistics, average price data and CPI-U.
Conclusion
Since 1980, both prices fell after inflation, chicken further than beef. The gap closed until 1998 and has widened since, to 3.3 pounds of chicken per pound of chuck in 2026, a level no earlier year reached.
For 2026 to end below 3, ground chuck would have to average $4.21 a pound from October to December, 35% under its September 2026 price, with chicken unchanged. With chuck unchanged, whole chicken would have to cost $2.82, more than in any month since 1990. Both thresholds are in September 2026 dollars.
Last updated — 14 October 2026
Disclaimer – Financial and Legal Information: The analyses, commentary, and content published on eco3min.fr are provided for informational and educational purposes only. They do not constitute investment advice or a solicitation to buy or sell financial instruments. Past performance is not indicative of future results. All investment decisions involve risk and are the sole responsibility of the reader. Data, charts and calculated series are provided as is and may contain errors or lag behind their source: check any figure against the primary source cited before relying on it. Content describing laws, regulations or contracts reflects the law as of its publication date and does not constitute legal or tax advice; applying it to a specific situation requires a qualified legal or tax professional.