
How Many Hours of Work Does It Cost? US Prices Since 1980
A price tag in dollars means little until you know how long you have to work to cover it. This tool converts the retail prices the Bureau of Labor Statistics actually collects into hours of work, item by item, from 1980 to 2025.
Measured in work-time, seven of the eight items tracked here cost less than they did in 1980. The exception is eggs, and only in 2025.
- Average hourly earnings for production and non-supervisory workers went from $6.85 in 1980 to $31.34 in 2025 (BLS, CES0500000008).
- A gallon of regular gasoline took 10.9 minutes of work in 1980 and 6.2 minutes in 2025; a pound of sugar fell from 3.7 minutes to 2.0.
- Eggs: 2025 is the only year out of 46 in which a dozen cost more work-time than in 1980 — 8.1 minutes against 7.4. By July 2026 it was back to 4.1.
TOOL · PRICES IN WORK-TIME · UNITED STATES 1980-2025
How long do you have to work for it?
Pick an item, then drag the year. The tool divides the BLS average retail price by average hourly earnings of production and non-supervisory workers in the same year.
Pick an itemYearWhat the tool computes
One division. The numerator is the average retail price of an item, as collected each month by the BLS for its Average Price Data programme. The denominator is average hourly earnings for the same year. The output is a duration — hours, minutes, or seconds, depending on how cheap the item is.
Both sides are annualised identically: the arithmetic mean of the monthly readings. A year enters the tool only if it has at least eleven readings. Nothing is interpolated, nothing is spliced. What you see is the ratio of two published numbers.
Why average earnings, not the minimum wage
The French version of this tool divides by the statutory minimum wage, which in France is indexed to inflation and adjusted at least once a year. The federal minimum wage in the United States works differently: it has stood at $7.25 an hour since July 2009. Dividing by a nominal figure that has not moved in seventeen years would produce a chart about one legislative decision, not about prices.
The denominator used here is instead average hourly earnings of production and non-supervisory employees in the private sector — series CES0500000008, monthly since 1964, and the wage measure that covers the large majority of private payroll employment. It is the standard rank-and-file wage measure, and it is the one that moves with the labour market rather than with Congress. Related: US real wage growth dataset and nominal versus real wages.
One consequence worth stating plainly: these are gross hours, before payroll taxes and before benefits. They are also an average, which sits above the median. Someone earning the federal minimum today would need about 4.3 times as many hours as the chart shows. Between that minimum and that average lies the full spread of US household incomes, year by year.
What the series shows
Across forty-five years, the direction is unusually consistent. Every item in the basket except one buys back more cheaply in work-time than it did in 1980 — and the spread between them is wide.
| Item | 1980 | 2025 | Change |
|---|---|---|---|
| Eggs, grade A large, dozen | 7.4 min | 8.1 min | +10 % |
| Utility (piped) gas, therm | 3.6 min | 3.1 min | −13 % |
| Bread, white pan, lb | 4.5 min | 3.6 min | −20 % |
| Ground chuck, 100 % beef, lb | 16.1 min | 11.8 min | −27 % |
| Electricity, kWh | 32 sec | 21 sec | −33 % |
| Chicken, fresh whole, lb | 6.2 min | 3.9 min | −36 % |
| Gasoline, unleaded regular, gallon | 10.9 min | 6.2 min | −43 % |
| Sugar, white, lb | 3.7 min | 2.0 min | −48 % |
Two things stand out. The first is that energy — the category that dominates the equivalent French chart on the way up — is on the way down here: gasoline, electricity and piped gas all cost less work-time in 2025 than in 1980, gasoline dramatically so. The second is that the American basket contains no services. The BLS collects average prices for goods and utilities, not for an hour of a plumber’s labour, which is precisely the line that barely moves in the French data. The comparison between the two pages is therefore partial by construction.
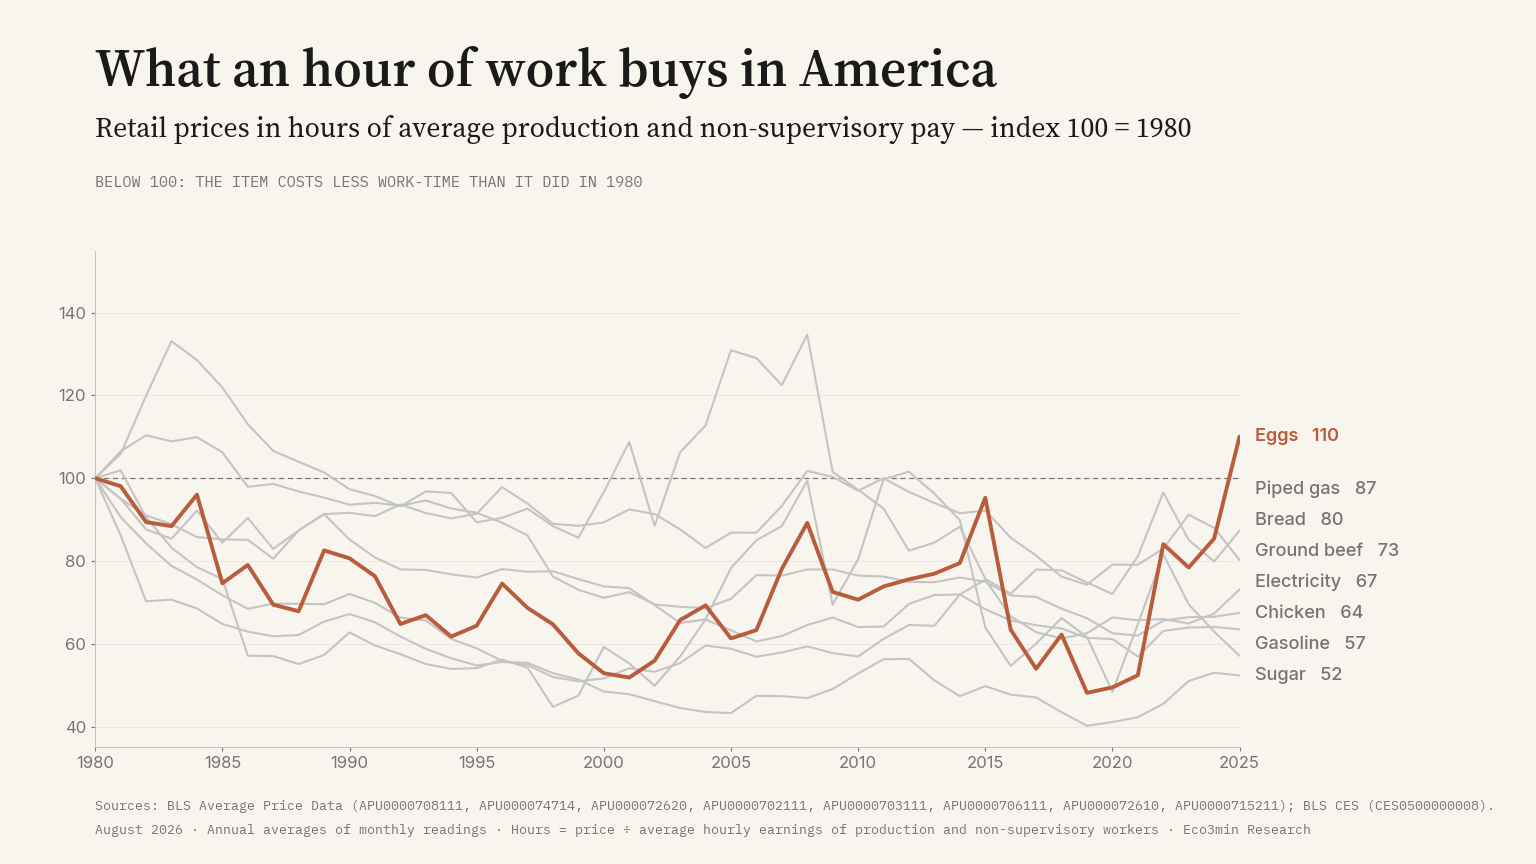
The egg exception, in context
Eggs are the one line that ends above where it started, and the detail matters. A dozen took 7.4 minutes of work in 1980. It fell to a series low of 3.6 minutes in 2019, then climbed through the 2022–2024 period and reached 8.1 minutes in 2025, on an average price of $4.25. That single year is the only one in forty-six above the 1980 mark — 2024, at 6.3 minutes, was still comfortably below it.
The most recent monthly reading, July 2026, puts eggs at $2.19 a dozen against average hourly earnings of $32.40 — 4.1 minutes of work, back near the bottom of the historical range. A reader arriving at this page in a year may find the annual figure has already reverted. That is the honest reading of a series with a supply shock in it: the level is not a trend.
Treating a falling work-time price as a statement about living standards. This ratio isolates one item and one wage series. It says nothing about housing, healthcare or education — the categories that dominate an American household budget and that the BLS average price programme does not cover. The useful reading is comparative, not aggregate.
The quality objection
Comparing an item across forty-five years assumes it is the same item. That holds only by degrees, which is why the tool labels each line with a comparability grade.
- High — gasoline, electricity, piped gas, bread, sugar, eggs. A kilowatt-hour is a kilowatt-hour; a pound of white sugar is a defined commodity. Here the measure says what it appears to say.
- Medium — ground chuck, whole chicken. The cut definition holds, but breed, feed and processing have all moved underneath it.
Items with severe quality drift — cars, phones, a square foot of housing — are absent from this tool. Not because they would be awkward to interpret, but because no homogeneous average-price series covers them across the period. They were excluded at the data stage, not argued away afterwards.
Data and reproducibility
The file holds, for every year from 1980 to 2025: average hourly earnings, the average price of each of the eight items, the corresponding work-time, and the number of monthly readings retained. Everything is recomputable from the series identifiers listed below.
Download the dataset (CSV, 1980-2025)
BLS series used: average hourly earnings CES0500000008; bread APU0000702111; eggs APU0000708111; ground chuck APU0000703111; whole chicken APU0000706111; sugar APU0000715211; gasoline APU000074714; electricity APU000072610; utility gas APU000072620.
Frequently asked questions
How long do you have to work for a gallon of gas in 2025?
Just over six minutes. The BLS average price for unleaded regular was $3.26 a gallon in 2025, against average hourly earnings of $31.34. In 1980 the same gallon took 10.9 minutes. The series low was 1998, at 4.9 minutes.
Why not use the federal minimum wage?
Because it has been frozen at $7.25 since July 2009. Any chart built on it would show every item rising steeply after 2009 regardless of what prices did — a picture of a policy decision rather than of the price series. Average hourly earnings for production and non-supervisory workers move with the labour market and exist monthly back to 1964.
Does this mean Americans are better off than in 1980?
It does not answer that question. The basket here is groceries, fuel and utilities. Housing, healthcare, childcare and higher education — the categories where American cost growth has been steepest — are not in the BLS average price programme and are absent from this tool. See US purchasing power, 1985 versus 2025 for a wider frame.
Why does the French version start in 1992 and this one in 1980?
Because the underlying collection programmes differ. The BLS has published average retail prices for these items monthly since 1980; the equivalent Insee series in France all begin in January 1992. Each page runs as far back as its own homogeneous data allows, and no further.
Why do the data stop at 2025?
The tool keeps complete years only, defined as at least eleven monthly readings. As of August 2026 the current year has seven. The latest monthly readings are quoted in the text but excluded from the annual averages.
Further reading
- US purchasing power: 1985 versus 2025 — the aggregate frame this tool deliberately avoids.
- US retail gasoline price dataset — the dollar series behind the steepest decline in the table.
- How the CPI is calculated — the collection machinery that produces these prices.
- US real wage growth dataset — the denominator, deflated.
- Food prices: speed, not level — why the rate of change and the level tell different stories.
Last updated — 6 October 2026
Disclaimer – Financial and Legal Information: The analyses, commentary, and content published on eco3min.fr are provided for informational and educational purposes only. They do not constitute investment advice or a solicitation to buy or sell financial instruments. Past performance is not indicative of future results. All investment decisions involve risk and are the sole responsibility of the reader. Data, charts and calculated series are provided as is and may contain errors or lag behind their source: check any figure against the primary source cited before relying on it. Content describing laws, regulations or contracts reflects the law as of its publication date and does not constitute legal or tax advice; applying it to a specific situation requires a qualified legal or tax professional.
Regulated and tax values: the rates, indices, caps and brackets with legal effect cited on this page are set by official decision, change over time and apply according to individual circumstances. Only the official publication in force on the relevant date is authoritative (for example the Journal officiel, INSEE, Banque de France, the IRS or the Social Security Administration). To revise a rent, sign or challenge a contract, or file a return, check the value at the source or with a professional.