
Is the US a net oil exporter?
The US has been a net petroleum exporter since 2020, at 2.8 million barrels a day in 2025 per the EIA. It still imports more crude oil than it exports.
The United States sells more crude oil and refined products abroad than it buys, a reversal that began in 2019 and has held since late 2021. Its refineries still import more crude than its producers export.
This page splits the trade balance by product, month by month, from the EIA series that start between 1920 and 2007.
Yes for petroleum since 2020, no for crude oil alone: the US exported 2.85 million barrels a day (mb/d) more than it imported in 2025, per the EIA.
- Exports of crude and products averaged 10.79 mb/d in 2025 and imports 7.94 mb/d; net imports first fell below zero in October 2019, and 2020 was the first full year of net exports.
- Refined products carry the surplus: net exports of 6.28 mb/d in July 2026, uninterrupted since June 2011.
- Crude stayed a net import every month since August 1944, at 1.85 mb/d over the twelve months to July 2026, mostly from Canada.
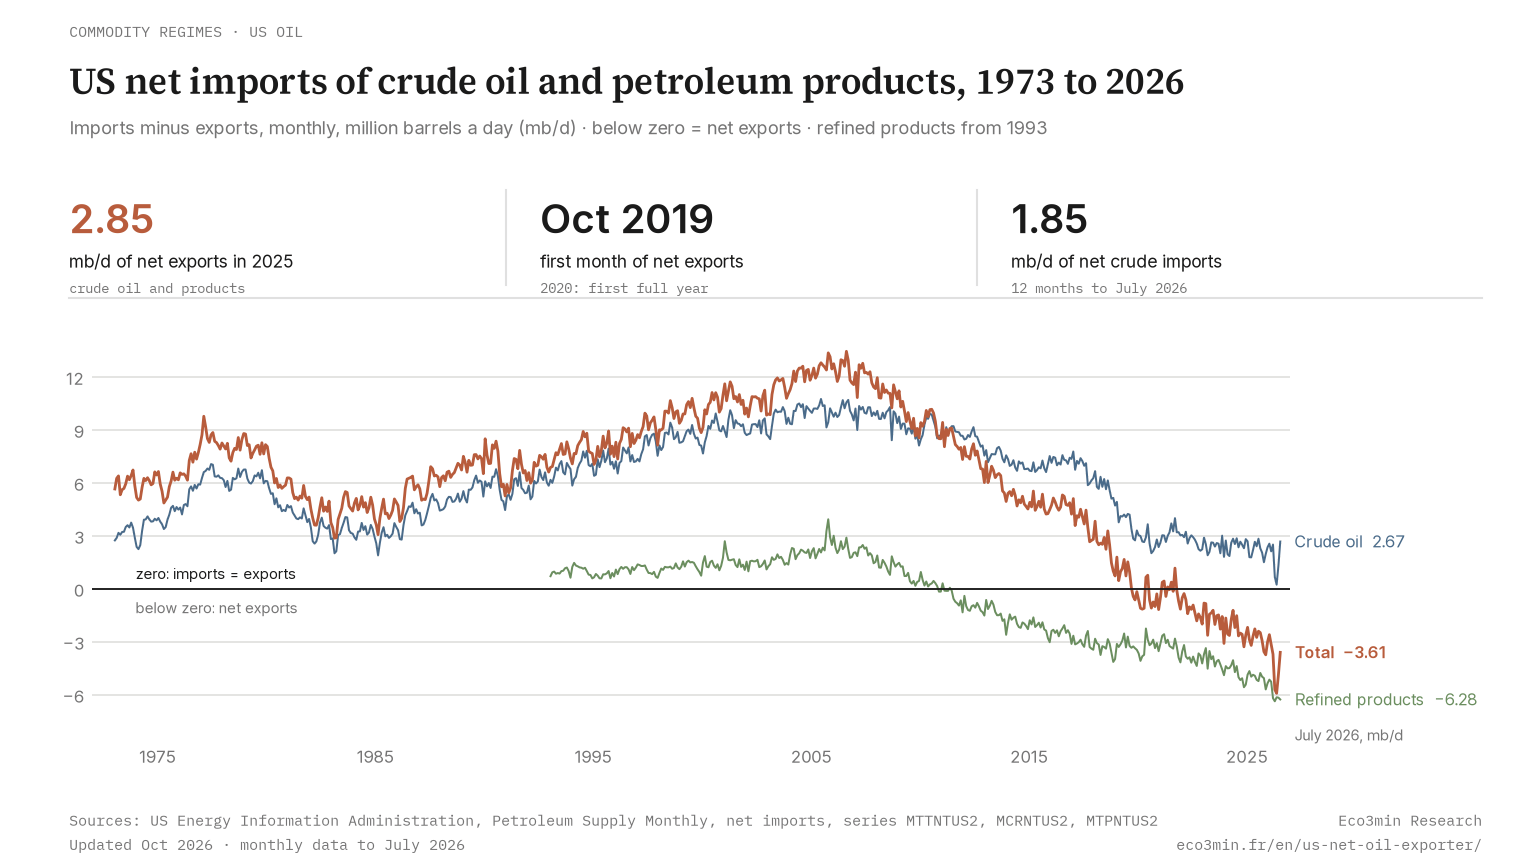
The short answer depends on what counts as oil. The EIA net import series reports imports minus exports, so a value below zero means net exports. On that measure, net imports of crude oil and petroleum products first fell below zero in October 2019, and 2020 was the first full year of net exports since the series began in 1973. In 2005 they had peaked at 12.55 mb/d. Net exports are often read as energy independence. The split by product shows the limits of that reading: crude oil, the feedstock of US refineries, is still a net import.
Net exporter of petroleum, still a net importer of crude.
Crude and products: two balances with opposite signs
The total hides two flows moving in opposite directions. In July 2026, the latest month published, net imports of crude oil stood at 2.67 mb/d while net imports of refined products were −6.28 mb/d, a net export. The sum, −3.61 mb/d, is the headline balance.
Two industries explain the pattern. US refineries take in domestic and imported crude and ship a large share of their gasoline and diesel abroad. Most US hydrocarbon gas liquids, propane among them, are separated from natural gas at processing plants, according to the EIA. The country exports processed products while it keeps buying crude as feedstock. The crude deficit has narrowed over two decades: net crude imports averaged 10.09 mb/d in 2005, the peak year, and 2.21 mb/d in 2025. Month to month the figure swings widely. It fell to 225,000 barrels a day in May 2026, the lowest since August 1948, then rose to 2.67 mb/d in July 2026.
Where the imported crude comes from
Gross crude imports averaged 6.17 mb/d in 2025, by country of origin in the EIA import data. Canada supplied 3.91 mb/d, or 63.4% of the total, followed by Mexico (383,000 barrels a day), then Saudi Arabia, Guyana, Brazil and Colombia, between 194,000 and 269,000 each. Crude also leaves in large volumes: exports averaged 3.96 mb/d in 2025 and reached a monthly record of 5.73 mb/d in May 2026.
The country buys and sells crude at the same time because grades differ and refineries are built to run particular blends. It can be the world’s largest producer, as the ranking of the world’s largest oil producers shows, and still import crude on a large scale. Price differences between domestic and seaborne crude, measured by the WTI–Brent arbitrage, shape how much US crude is exported each month.
Product by product: when each one turned
Each product crossed the line at its own date. The tool below switches between the seven EIA series and plots the monthly balance since each series starts. It returns the first month of net exports, the month from which the balance stayed negative, and the number of months spent as a net exporter.
The default view is the total, which flipped 11 times between October 2019 and October 2021 before settling. Products had settled a decade earlier: finished gasoline in September 2009, distillates in February 2010, all products together in June 2011, hydrocarbon gas liquids in January 2012. Jet fuel came last, in June 2023. Crude oil never did, with 106 months of net exports out of 1,279, all before August 1944.
| Product | EIA series starts | Net exporter every month since | Months as net exporter | Net imports, July 2026 (kb/d) |
|---|---|---|---|---|
| Crude oil and products | January 1973 | October 2021 | 75 of 643 | −3,608 |
| Crude oil | January 1920 | never (net importer) | 106 of 1,279 | 2,668 |
| All petroleum products | January 1993 | June 2011 | 187 of 403 | −6,276 |
| Finished motor gasoline | January 1945 | September 2009 | 395 of 979 | −767 |
| Distillate fuel oil | January 1945 | February 2010 | 465 of 979 | −1,606 |
| Hydrocarbon gas liquids | January 2007 | January 2012 | 188 of 235 | −3,243 |
| Kerosene-type jet fuel | January 2004 | June 2023 | 158 of 271 | −288 |
Measured over calendar 2025, the largest surplus is not gasoline or diesel. Net exports of hydrocarbon gas liquids, the propane, ethane and butane recovered at gas processing plants and refineries, averaged 2.88 mb/d, against 1.09 mb/d for distillates and 654,000 barrels a day for finished gasoline. Gas liquids made up 57.0% of the net export balance of all products, 5.06 mb/d.
The gasoline line needs one caveat. It covers finished motor gasoline only. Refiners also trade blending components, reported separately, and adding them shrinks the surplus: finished gasoline and components together were a net export of 221,000 barrels a day in 2025. The combined balance was a net import in 94 of the 203 months since September 2009, the last in June 2025.
From the largest importer to a net exporter
The trajectory has three phases. In 1973, the first year of the series, net imports were 6.03 mb/d, and 8.57 mb/d in 1977, the year the first oil entered the emergency reserve: the stockpile was sized for a country whose dependence was rising. After a dip to 4.29 mb/d in 1985, net imports climbed to the 12.55 mb/d of 2005 as domestic output fell. The shale era reversed both trends. Production rose from 2009, refiners turned to export markets, and the rise in US crude output since 2008 took the balance through zero in October 2019.
The surplus widened every year after 2021. Net exports were 635,000 barrels a day in 2020, only 62,000 barrels a day in 2021 as demand recovered, then 1.19 mb/d in 2022, 1.71 mb/d in 2023, 2.27 mb/d in 2024 and 2.85 mb/d in 2025. The monthly record is 5.93 mb/d, in May 2026. These values are revised with each Petroleum Supply Monthly, so the first negative month is read on the release of 30 September 2026.
A net exporter is often described as energy independent, as if it no longer needed foreign oil. The US still imported 7.94 mb/d of crude and products in 2025, most of it crude, and its refineries depend on those barrels to run at the grades they were designed for. The correct reading is that exports now exceed imports in volume, with large flows in both directions.
What the balance means for the emergency reserve
The reserve was created to cover a shortfall in imports. That shortfall no longer exists in aggregate, but the reserve still holds crude, and crude is the one flow the country does not balance. A disruption to Canadian or Gulf supply would reach refineries that run imported grades even while the country exports products, a point that bears on why the US keeps an emergency crude stock. The commodity setting around these flows, from shipping to refining margins, is mapped in physical oil and gas markets.
The net export balance is therefore a statement about volumes, not about exposure. It turned for petroleum as a whole between 2019 and 2021, a decade earlier for refined products, and not at all for crude oil.
Last updated — 9 October 2026
Disclaimer – Financial and Legal Information: The analyses, commentary, and content published on eco3min.fr are provided for informational and educational purposes only. They do not constitute investment advice or a solicitation to buy or sell financial instruments. Past performance is not indicative of future results. All investment decisions involve risk and are the sole responsibility of the reader. Data, charts and calculated series are provided as is and may contain errors or lag behind their source: check any figure against the primary source cited before relying on it. Content describing laws, regulations or contracts reflects the law as of its publication date and does not constitute legal or tax advice; applying it to a specific situation requires a qualified legal or tax professional.