
France Inflation Calculator: the Value of Money Between Two Years
Calculator — French inflation and the value of money (1901-2025)
Official INSEE coefficients. For an amount denominated in francs, use the franc ↔ euro converter.
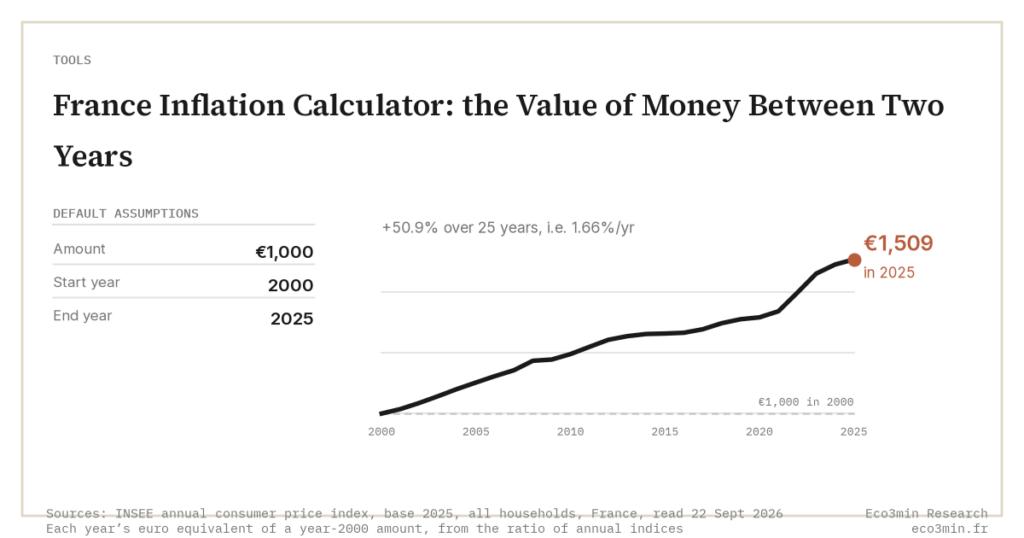
This calculator answers one question: what sum of money today buys what a sum of money bought in the past? It applies the official purchasing-power transformation coefficients published by INSEE, France’s national statistics institute, on the consumer price index in annual average terms, from 1901 to 2025. Worked example: €1,000 in 2000 is equivalent to €1,513 in 2025 — 51.3% cumulative inflation, or 1.67% a year on average over twenty-five years.
Enter an amount, a start year and an end year. The calculation runs both ways: bring an old amount forward, or take a current amount back in time.
What a sum of money is worth between two years
Enter an amount, a start year and an end year: the tool applies the official INSEE purchasing-power coefficients (annual average CPI) and returns the equivalent amount, cumulative inflation and the average annual rate over the period. Amounts are shown in euros for every year, including before 2002.
Source: INSEE purchasing-power transformation coefficients (series 011813530, base 2025 = 100), annual average French CPI 1901–2025 · 1914–1918 and 1939–1949: INSEE reconstructed data, coefficients published rounded · observed historical series, retrospective and non-predictive (no projection) · general price index: it does not describe an individual consumption basket · Eco3min — educational tool, neither advice nor a recommendation.
Results are indicative and educational. They are neither investment advice nor a recommendation, and cannot serve as a legal reference (rent, maintenance payments, indexed contracts).
How to read the result
Three figures are displayed, and they do not measure the same thing.
- Cumulative inflation is the total price increase between the two years. It is a whole-period percentage, not a rate: +51.3% between 2000 and 2025 does not mean 51.3% a year.
- The equivalent amount is the sum that, in the end year, buys the same basket of goods and services as the amount entered for the start year.
- Average annual inflation is a geometric mean, not an arithmetic average of yearly rates. It answers the question: what constant rate, applied every year, would have produced the same total increase?
The formula is a simple ratio of index levels. Writing I for the price index of a given year:
equivalent amount = amount × (Iend / Istart)
And the average annual rate: (Iend / Istart)1/n − 1, where n is the number of years. The curve below the calculator shows the general price level since 1901 on a logarithmic scale — without it, everything before 1960 would collapse onto the axis.
What €1,000 from a past year is worth in 2025 euros
The reference values most often looked up, computed on the same INSEE coefficients as the calculator.
| €1,000 in… | is worth in 2025 | cumulative inflation | annual average |
|---|---|---|---|
| 1960 | €12,563 | +1,156% | 3.97% |
| 1970 | €8,460 | +746% | 3.96% |
| 1980 | €3,303 | +230% | 2.69% |
| 1990 | €1,795 | +79% | 1.68% |
| 2000 | €1,513 | +51% | 1.67% |
| 2010 | €1,277 | +28% | 1.64% |
| 2015 | €1,209 | +21% | 1.92% |
| 2020 | €1,155 | +15% | 2.92% |
The last row is the instructive one: five years (2020-2025) produced 15.5% cumulative inflation, against 10.6% for the whole 2010-2020 decade. The recent five-year pace — 2.92% a year — is the highest of any five-year window since 1988-1993 (2.93%).
French inflation by decade
| Period | Price multiplier | Cumulative inflation | Annual average |
|---|---|---|---|
| 1960-1970 | × 1.48 | +48.5% | 4.03% |
| 1970-1980 | × 2.56 | +156.2% | 9.86% |
| 1980-1990 | × 1.84 | +84.0% | 6.29% |
| 1990-2000 | × 1.19 | +18.6% | 1.72% |
| 2000-2010 | × 1.19 | +18.5% | 1.71% |
| 2010-2020 | × 1.11 | +10.6% | 1.01% |
| 2020-2025 | × 1.15 | +15.5% | 2.92% |
The 1970s dominate everything else: prices were multiplied by 2.56 in ten years, close to 10% a year. That is the regime described in our complete guide to inflation, and it is also why amounts quoted in 1970s francs look so trivial today.
Where the numbers come from: the INSEE coefficients
The calculator does not use an assumed average inflation rate. It uses the table of purchasing-power transformation coefficients published every year by INSEE (series 011813530, base 2025 = 100) — the same table that powers the institute’s official converter. Once a year, that table appears on a date set like every other INSEE output, and those dates sit in the French data release schedule.
That table chains three successive indices, which explains part of its limitations:
- 1901-1992: index for urban households headed by a manual or clerical worker. It is the broadest population for which an index exists over that period.
- 1993-1998: all-households index, metropolitan France.
- From 1999: all-households index, whole of France (overseas departments included).
Two periods are reconstructed rather than observed: 1914-1918 and 1939-1949. The coefficients are also published rounded, which becomes material for distant years — a coefficient given to two decimals around 0.03 carries a relative uncertainty of several percent. The calculator therefore rounds its output when the start year precedes 1950, rather than displaying a precision the data does not support.
How the index itself is built — 200,000 price observations, weights revised annually, hedonic adjustment — is set out in our analysis of INSEE’s methodology. The raw series are downloadable on our France consumer price index and France inflation rate dataset pages.
What this calculator does not say
An inflation calculator produces an exact figure on a narrow question. Three misunderstandings come up systematically.
1. The general index is not your basket. The CPI weights the average consumption of French households. A tenant in a tight rental market, a household driving 25,000 km a year, a household with no children in school do not share the same exposure. The gap between measured and perceived inflation is not a measurement error: it comes from the structure of spending, and from the salience of frequently seen prices (fuel, food) against rarely seen ones.
2. The result has no legal standing. INSEE states it explicitly: these coefficients are statistical data, surrounded by uncertainty that grows with distance in time. A rent revision runs on the IRL index, a maintenance payment on the index specified by the court decision — not on a purchasing-power converter.
3. An adjusted amount is not an invested amount. Restating €1,000 from 2000 as €1,513 in 2025 measures the erosion of capital that stayed still. Invested capital may have earned a return — of which only the part above inflation is a real gain. That is the distinct purpose of the real return after inflation calculator, which applies the Fisher equation.
Three sibling tools extend this one: the franc ↔ euro converter for an amount denominated in the old currency, the US inflation calculator for the same operation on the dollar since 1913, and the compound interest calculator to project capital forward rather than restate it backward.
Past inflation and future inflation are two different exercises
This calculator is retrospective. It reads an observed series and projects nothing — a methodological constraint rather than a technical limitation: the future price level depends on variables (energy, wages, monetary policy, supply shocks) that no extrapolation of a past average captures.
The forward-looking question — what will my savings be worth in ten years? — is posed differently. It does not consist of extending the curve, but of testing how sensitive a result is to an inflation assumption chosen explicitly. The real return on a holding turns negative as soon as inflation exceeds its nominal rate: at 3% inflation, a holding returning 2.5% loses about 0.49% of purchasing power a year. The real return calculator is built for that use, and the case of the Livret A gives the historical illustration.
The pace of erosion depends on the prevailing macro regime — inflation persistently above target does not have the same cumulative effect as a one-quarter spike. To place the current regime: macro regime in force →
Frequently asked questions
How do you calculate inflation between two dates?
Divide the price index of the end year by the price index of the start year. The result minus 1 gives cumulative inflation. Example: the INSEE index stands at 66.08 in 2000 and 100 in 2025 (2025 base); the ratio is 1.513, so prices rose 51.3% in total. To convert an amount, multiply it by that same ratio.
What is €1,000 from 2000 worth today?
€1,000 in 2000 corresponds to €1,513 in 2025 in purchasing power, on the general consumer price index. Put the other way, €1,000 left without any return between 2000 and 2025 lost 33.9% of its purchasing power.
What is average inflation in France over the long run?
It depends entirely on the window chosen, and the spread is wide: 9.86% a year over the 1970s, 1.01% over the 2010s, 2.92% between 2020 and 2025. Across 1990-2025 the geometric mean is 1.68% a year. Quoting “average French inflation” without stating the period therefore means little.
Does the calculator work with amounts in francs?
This calculator works in euros for every year, including before 2002: a “1980 euro” means the value of a 1980 franc divided by 6.55957. It displays the franc equivalent of the period below the result. To enter an amount directly in francs or old francs, the franc ↔ euro converter is the right tool.
Can these figures be used to revise a rent or a maintenance payment?
No. INSEE states that these statistical data cannot serve as a legal reference. Contractual revisions rely on dedicated indices — the IRL for residential rents, the index named in the court decision for a maintenance payment.
Why do results differ from one calculator to another?
Three main causes: the population covered (whole of France or metropolitan only), the type of average (annual average or December-to-December change), and the base year of the coefficients. This calculator uses the annual average on the whole-of-France scope since 1999, on a 2025 base — exactly the settings of the official INSEE converter, which makes the two results identical to the cent.
Key takeaways
- Restating a sum means multiplying by the ratio of two price index levels: no assumed average inflation rate is involved.
- €1,000 from 2000 is worth €1,513 in 2025; €1,000 from 1980 is worth €3,303.
- Cumulative and average annual inflation measure two different things: +51.3% over twenty-five years corresponds to 1.67% a year.
- The data are statistical, not legal, and lose precision the further back you go before 1950.
- The index describes an average basket. The gap with perceived inflation comes from each household’s spending structure, not from a measurement flaw.
- This tool is retrospective: it does not project future inflation and is neither advice nor a recommendation.
Last updated — 6 October 2026
Disclaimer – Financial and Legal Information: The analyses, commentary, and content published on eco3min.fr are provided for informational and educational purposes only. They do not constitute investment advice or a solicitation to buy or sell financial instruments. Past performance is not indicative of future results. All investment decisions involve risk and are the sole responsibility of the reader. Data, charts and calculated series are provided as is and may contain errors or lag behind their source: check any figure against the primary source cited before relying on it. Content describing laws, regulations or contracts reflects the law as of its publication date and does not constitute legal or tax advice; applying it to a specific situation requires a qualified legal or tax professional.
Regulated and tax values: the rates, indices, caps and brackets with legal effect cited on this page are set by official decision, change over time and apply according to individual circumstances. Only the official publication in force on the relevant date is authoritative (for example the Journal officiel, INSEE, Banque de France, the IRS or the Social Security Administration). To revise a rent, sign or challenge a contract, or file a return, check the value at the source or with a professional.
Read next
Full pillar →Real Return After Inflation (Calculator & Formula Explained)
🧭 eco3min analysis tool: Methodological framework Simulator: Real return after inflation Measure inflation's impact on your returns. A…
French Franc to Euro Calculator (1901–2025)
Converting a French franc amount into today's euros takes two separate operations: the currency change (old francs, new…
Compound Interest Calculator: Estimate Investment Growth and Monthly Savings
🧭 eco3min analysis tool: Methodological framework Calculator: Compound interest Visualize the trajectory shaped by your assumptions: nominal and…