
How large are US oil reserves, and how do they compare with the SPR?
US proved reserves of crude oil and condensate were 46.0 billion barrels at end-2024, per the EIA, about nine years of output. The SPR is a separate stock.
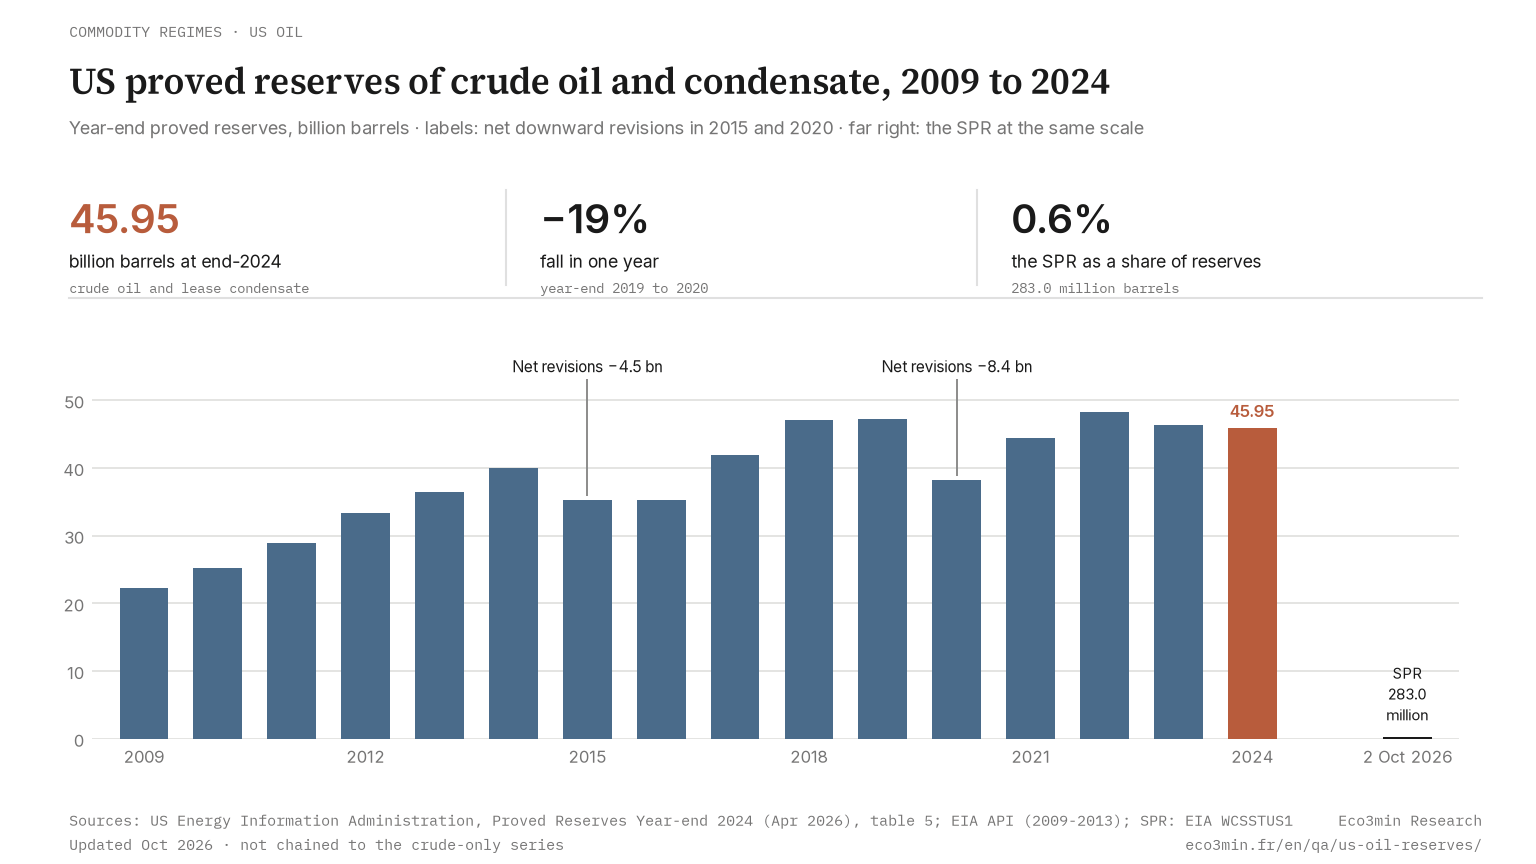
According to the EIA, US proved reserves of crude oil and condensate stood at 45.95 billion barrels at end-2024, oil in known fields that pays to extract at current prices and costs. Because the estimate uses the year’s average of first-of-the-month prices, a price fall shrinks it, as in 2020 when reserves dropped 19%, and new drilling refills it. The Strategic Petroleum Reserve is a separate stock of crude already extracted and stored in salt caverns, 283.0 million barrels on 2 October 2026, or 0.6% of proved reserves.
In this article
The short answer
45.95 billion barrels of crude oil and lease condensate, the light liquid recovered from natural gas at field separators. That is the US Energy Information Administration’s count of proved reserves at the end of 2024, in its annual reserves report of 7 April 2026, down 1% in a year. Texas holds 43%, followed by New Mexico and the federal waters of the Gulf.
Proved reserves are oil still underground that operators expect, with reasonable certainty, to recover from known fields at current prices and costs. The Strategic Petroleum Reserve is crude already extracted and held in salt caverns: 283.0 million barrels on 2 October 2026 in the EIA’s weekly stock data, or 0.6% of proved reserves.
Divided by 2025 field production of 13.66 million barrels a day, proved reserves equal about 9.2 years of output, a dated ratio for an estimate restated every year. On the EIA’s crude-only series, reserves more than doubled from 2008 to 2019, from 19.1 to 44.2 billion barrels, while production rose 2.47 times. Proved reserves count oil that pays to extract, not oil that exists.
→ The emergency stock: the level of the Strategic Petroleum Reserve
What the data shows
Oil reserves in the United States are counted through Form EIA-23L, a mandatory survey of field operators. For 2024, 385 of 398 sampled operators responded, covering about 95% of proved oil reserves.
From the year-end 2024 report (mainly Table 5 and Table 6, million barrels):
- Total: 45,951 at the end of 2024, against 46,422 a year earlier and a peak of 48,321 in 2022, the highest on the combined series.
- By area: Texas 19,644, New Mexico 7,068, federal offshore waters 4,626 (4,563 in the Gulf), North Dakota 3,867, Alaska 3,124. The four largest states hold 73.3%.
- Status: 17,108, or 37.2%, had not produced during the year, a category that includes proved undeveloped reserves.
- Shale plays: 27.5 billion barrels, 60% of the total.
- Reserves over the same year’s field production (EIA series MCRFPUS2, Eco3min calculation): 11.4 years in 2009, 14.0 in 2011 and 2012, a low of 9.2 in 2020, 9.5 in 2024.
The two EIA series do not join. Crude alone runs from 1899 to 2021, ending at 41,151 million barrels after a peak of 44,191 in 2019, because from report year 2022 the survey records crude oil and condensate together. The chart traces the combined series alone, from 2009. Its 2019 value differs by vintage, 47,107 in the EIA’s online data and 47,172 in the latest Table 5, used here.
→ Dataset: annual US crude oil production since 1920
Why proved reserves move with prices and drilling
A proved reserve is an economic estimate that moves with prices, costs and drilling.
The price rule. Under SEC rules adopted in 2008 and applied by the EIA, reserves are valued at the average of the year’s twelve first-of-the-month prices, which replaced the 31 December price (Form EIA-23L instructions). A lower average removes barrels that no longer pay. In 2020 that average fell 28% for WTI, to $39.66 a barrel from $55.17, according to the EIA report for 2020. Net revisions in the latest Table 5 took 8.4 billion barrels off the total.
Drilling refills the shelf. The common picture is a tank that drains. Each year, operators book extensions and discoveries as new wells delineate fields. From 2014 to 2024 they produced 43.9 billion barrels, 1.2 times the 36.5 billion proved at the end of 2013, and still closed 2024 with 46.0 billion.
What the definition leaves out. The EIA’s survey instructions exclude crude placed in underground storage, so the emergency reserve never enters the total. Reasonable certainty, for the EIA, means a recovery probability of at least 90%, which leaves out oil known but uneconomic, or lying in undrilled prospects.
Three regimes stand out on the combined series. From 2009 to 2014, as directional drilling and hydraulic fracturing spread through tight formations such as the Bakken, reserves rose from 22.3 to 39.9 billion barrels, with WTI averaging $95 a barrel in 2014 per the EIA. The price collapses of 2015 and 2020, the second after the pandemic cut fuel demand, brought net downward revisions of 4.5 and 8.4 billion barrels. In 2023 and 2024, with prices below their 2022 highs, revisions of 3.9 and 3.8 billion offset most of each year’s additions. The 12-month average price is the switch that decides whether a year’s drilling adds to the total or merely replaces output.
Proved reserves are a shelf that drilling restocks each year at that year’s prices, which is why 11 years of pumping left it fuller.
→ Framework: oil, gas and critical minerals markets
What it means for different economic actors
Investors and analysts. Company filings follow the same SEC price rule but count the reserves a company owns, while the EIA counts those each operator runs. The averaging was meant to damp price swings, so a fall in oil prices reaches reported reserves gradually.
Producers. In 2015, as the average oil price fell 47%, the EIA report for that year traced downward revisions to development plans postponed or cancelled. On that logic, the 17.1 billion nonproducing barrels of 2024 are the most exposed to such decisions.
Public debate. Rankings of oil reserves by country come from other bodies, since the EIA no longer publishes them. Its international data cover production, where the United States ranks first among the world’s largest crude producers.
A common error is to read 9.2 years of output as the date US oil runs out. On that reading, the 11.4 years of 2009 would have expired in 2020, and 2025 brought record output instead.
Practical observation
What the data suggests for understanding your situation:
- Question to ask yourself: is the figure in front of me a proved reserve at one year’s prices, a resource estimate that ignores prices, or the emergency stock?
- Data to monitor: extensions and discoveries against estimated production in Table 5 of the EIA’s April report, 5,145 and 4,806 million barrels in 2024. A positive gap means drilling outpaced output, before revisions.
- Historical parallel: in 2015 net revisions removed 4.5 billion barrels and proved reserves fell 11.8%, while production rose 7.1%.
- What the literature documents: M. A. Adelman (1990, The Review of Economics and Statistics) treats oil reserves as an inventory that development spending replenishes, consistent with the EIA tables for 2014 to 2024.
This is descriptive information to help you frame your own analysis. Eco3min does not provide investment advice.
Go deeper
📁 Datasets: the inflation-adjusted oil price · daily WTI spot price data
📖 Related analysis: WTI as a signal of the economic cycle
Related questions
Frequently asked questions
Does the Strategic Petroleum Reserve count as part of US oil reserves?
No. The EIA’s survey definitions exclude crude placed in underground storage, so the 283.0 million barrels held by the reserve on 2 October 2026 sit outside the 45.95 billion. Measured against 2025 output, the emergency stock equals about 20.7 days of production and proved reserves about 9.2 years, two dated ratios. The reserve’s barrels are already produced and paid for. Proved reserves still need wells, crews and a price that covers their cost.
Why did US proved reserves grow while the country kept pumping?
Drilling has turned known resources into economic ones faster than wells deplete them. Table 5 of the EIA’s latest report breaks down 2014 to 2024: production took 43.9 billion barrels, extensions and discoveries added 56.4 billion, net revisions removed 15.3 billion and net acquisitions added 12.2 billion. The end-2013 total of 36.5 billion became 46.0 billion. Restocking slows when the 12-month price falls, as in 2015 and 2020. It has also lagged the rise in output, since reserves fell from 12.5 years of same-year production in 2014 to 9.5 in 2024.
How do proved reserves differ from technically recoverable resources?
Technically recoverable resources count oil that existing technology could extract, whatever the price. In the assumptions to its Annual Energy Outlook 2022, the EIA put US technically recoverable crude, condensate included, at 373.1 billion barrels on 1 January 2020, 47.1 billion of them proved and 326.0 billion unproved. Proved reserves were thus 12.6% of the total. The EIA calls these resource estimates highly uncertain, especially in young plays with few wells.
Last updated — 9 October 2026
Disclaimer – Financial and Legal Information: The analyses, commentary, and content published on eco3min.fr are provided for informational and educational purposes only. They do not constitute investment advice or a solicitation to buy or sell financial instruments. Past performance is not indicative of future results. All investment decisions involve risk and are the sole responsibility of the reader. Data, charts and calculated series are provided as is and may contain errors or lag behind their source: check any figure against the primary source cited before relying on it. Content describing laws, regulations or contracts reflects the law as of its publication date and does not constitute legal or tax advice; applying it to a specific situation requires a qualified legal or tax professional.