
Yen Carry Trade: The Hidden Leverage Shaking Forex and Portfolios
The yen has weakened ≈25% against the dollar since 2022, fueling a carry trade that funds positions in US tech equities, high yield bonds and crypto. The Fed–BoJ differential above 4 points keeps the trade running, but a moderate BoJ hike could trigger violent unwinds reminiscent of 2008 and 2016.

The yen carry trade is fueling massive flows in FX markets in 2025. Why this leverage can unwind violently and what observed allocation patterns reveal.
TL;DR
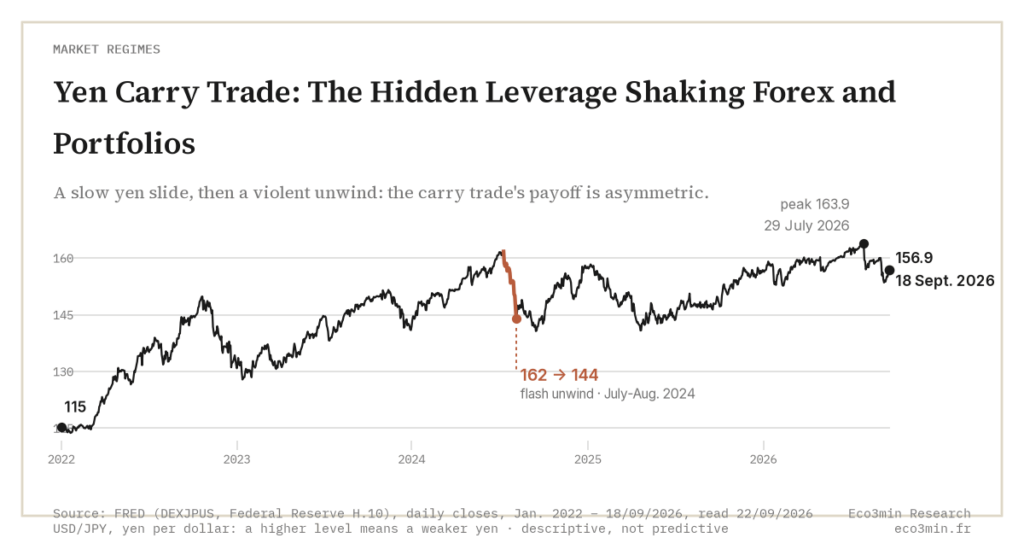
The yen carry trade is a discreet engine of global risk-taking: the yen has lost 26% against the dollar between January 2022 and September 2026, funding positions across tech, high yield and crypto.
- The Fed–BoJ policy-rate differential has narrowed from 5.25 points in early 2024 to about 2.9 points on 21 September 2026; USD/JPY reached 163.86 on 29 July 2026 and stood at 156.87 on 18 September, still priced as a funding currency rather than a haven.
- History shows the sequence — carry over-extension, FX volatility shock, forced unwind in a few sessions — as in 2008 and 2016.
- The BoJ did raise its overnight rate by 50bps over 2026 without triggering an unwind; the reversal came from positioning instead, with leveraged funds flipping from a record short in June to net long on 15 September 2026.
Market signals as of 18 September 2026
- USD/JPY high and volatile: the pair peaked at 163.86 on 29 July 2026 and stood at 156.87 on 18 September, within a twelve-month range of 146.36 to 163.86 (FRED, DEXJPUS). The market is still pricing the yen as a “funding currency,” not a safe haven.
- Carry narrower, still wide: the Fed raised its target to 3.75-4.00% on 17 September 2026 after cutting it to 3.50-3.75% on 11 December 2025, while the Japanese overnight call rate rose to 0.98% in August 2026 from 0.48% a year earlier (FRED). The policy-rate gap has fallen from 5.25 points in early 2024 to roughly 2.9 points.
- Speculative positioning reversed: leveraged funds matched their record short on 30 June 2026, at 115,400 contracts against 110,635 on 9 July 2024, then flipped within three weeks: 49,098 short on 8 September, 23,170 long on 15 September (CFTC, Traders in Financial Futures). USD/JPY lost six yen over the same window.
- Volatility still contained: three-month realised volatility on USD/JPY stands at 9.7% on 18 September 2026, against 7.1% in late July and a 17.0% peak in December 2022 (Eco3min calculation on FRED closes). The gap between that volatility and the concentration of positions remains the sharpest weak signal in this regime.
The macro angle: what these signals actually reveal
In 2025, the yen carry trade has once again become the silent backbone of FX markets. In practice, investors borrow in yen at very low cost, convert into dollars, euros or Australian dollars, then deploy those funds into higher-yielding assets: BBB-rated corporate bonds at 5–6%, emerging market debt at 7–9%, even yield-bearing stablecoins at ≈4–5% since mid-2024. This mechanism of differentials and cross-border flows sits within the Eco3min framework on currencies and FX, which structures the reading of exchange-rate regimes.
On the macro side, Japanese inflation ran at 2.9% year-on-year in November 2025, eased to 2.1% in December and to 2.0% in August 2026 (Statistics Bureau, all items), with barely positive real wages, leaving the Bank of Japan limited policy room. As long as it avoids abrupt tightening, the market treats the yen as “quasi-free money.” As a result, outbound Japanese capital flows resumed strongly in 2024–2025, notably toward US investment-grade bonds and global equity ETFs.
At the micro level, the phenomenon directly affects corporates. Japanese conglomerates issue yen debt at still-very-low coupons (often <1.5% for solid credits in 2025) and reinvest part of that liquidity outside the country. On the Western side, European or Asian exporters take advantage of the weak yen to lock in long-term contracts billed in dollars rather than yen, leaving banks to manage complex hedges. This mechanism improves short-term margins but raises sensitivity to FX shocks. For context: what moves a currency pair.
The yen carry trade mechanism cannot be understood in isolation from the global monetary regime dominated by a structurally strong dollar. Rate differentials, the appeal of dollar-denominated assets and the greenback’s reserve currency role directly condition the scale and durability of these flows. This broader reading is developed in the reference analysis dedicated to the strong dollar and its impacts on financial markets.
Where the yen leg shows up in a portfolio
The carry leg is rarely labelled as such, which is why it is easy to miss. Three places where it surfaces:
- Directional yen exposure. A euro- or dollar-based portfolio holding Japanese equities unhedged is long the yen leg by construction: between January 2022 and September 2026 the currency subtracted 26% from any unhedged yen asset measured in dollars (FRED, DEXJPUS).
- Funded assets. High yield, emerging-market debt and crypto are the classic destinations of yen-funded money. When the funding leg reverses, those three move together regardless of their own fundamentals, which is what turns a currency move into a cross-asset drawdown.
- Corporate cash flows. Exporters to Japan and importers from Japan carry the same variable inside their margins; hedging it has a cost set by the rate differential, which has itself halved since early 2024.
The measurable variables are the same in all three cases: the policy-rate gap, the ten-year yield gap and the concentration of speculative positioning reported weekly by the CFTC.
Weak signals to watch closely
- Japanese 10-year yield: the BoJ ended yield-curve control in March 2024 and the 10-year JGB has climbed on its own to 2.94% in August 2026, from 1.81% in November 2025 (OECD via FRED). Every point it gains compresses the forward carry.
- USD/JPY daily moves: sessions above 2% remain rare, eleven since January 2024, four of them in July-August 2024 and three in 2026 (26 January, 30 July, 3 September). Their clustering is the marker of forced unwinds.
- Japanese insurers’ moves: if insurers repatriate US/EU bonds en masse, this signals a domestic regime change.
- Yen — S&P 500 correlation: stronger yen + falling equities = return of the safe-haven function.
Possible scenarios: 3–12 month horizon
Carry continuity
The BoJ keeps normalising in small steps and USD/JPY stays in the high range it has occupied since 2024. The yen carry trade continues to fuel flows into US equities and corporate bonds, and the funded asset classes keep trading with the funding leg rather than with their own fundamentals. A related angle is developed in our side-by-side of HY and IG through the cycle.
Gradual normalisation
This one happened: the Japanese overnight call rate went from 0.48% in November 2025 to 0.73% in January 2026 and 0.98% in August 2026. The yen did not appreciate as a result, and history did not promise it would: twelve months after the August 2000 hike the yen was 11% weaker against the dollar, and 5% weaker twelve months after the July 2006 hike; only the February 2007 move was followed by a 12% appreciation. The ten-year yield gap did compress, from 2.96 points in June 2025 to 1.74 in August 2026.
Liquidity shock
A global stress event (US credit, geopolitics, energy shock) triggers a flight to safety. In the two documented precedents the yen gained 36% between July 2007 and January 2009 and 20% between December 2015 and June 2016, while leveraged and carry-funded asset classes recorded double-digit drawdowns in a handful of sessions. Reductions of that kind are executed by the very vehicles whose exit defines the channel through which hedge fund positioning reaches market stability.
Cross-cutting indicator to watch: the spread between US and Japanese 10-year yields. It stood at 2.96 points in June 2025, 2.08 in December 2025 and 1.74 in August 2026, so the two-point threshold often described as the breaking point was crossed without an unwind on the scale of 2008 or August 2024. The rate gap measures how profitable the carry is, not when it turns; the turn shows up in positioning, which took four months to unwind in 2026.
Conclusion
The yen carry trade is not a technical topic reserved for FX traders: it currently shapes equity, crypto and bond valuations across the globe. As long as the yen remains a cheap funding currency, the search for yield dominates. But the more the spring is wound, the more violent the potential reversal becomes. Tracking allocation calibrations, simple KPIs and implicit yen bets has historically delivered a meaningful analytical edge in such regimes. Implicit bets of that kind are only trackable when someone reports them, which is precisely what the swap structures that kept a concentrated book invisible removed.
- The yen has lost 26% against the dollar between January 2022 and September 2026. This is not a detail: it is the discrete engine of global risk-taking via the carry trade.
- The US-Japan 10-year spread fell from 2.96 points in June 2025 to 1.74 in August 2026 without the unwind that the usual thresholds would have implied.
- Positioning turned instead: leveraged funds went from a record 115,400-contract short on 30 June 2026 to net long on 15 September, and USD/JPY lost six yen in the process.
Last updated — 6 October 2026
Disclaimer – Financial and Legal Information: The analyses, commentary, and content published on eco3min.fr are provided for informational and educational purposes only. They do not constitute investment advice or a solicitation to buy or sell financial instruments. Past performance is not indicative of future results. All investment decisions involve risk and are the sole responsibility of the reader. Data, charts and calculated series are provided as is and may contain errors or lag behind their source: check any figure against the primary source cited before relying on it. Content describing laws, regulations or contracts reflects the law as of its publication date and does not constitute legal or tax advice; applying it to a specific situation requires a qualified legal or tax professional.
Read next
Full pillar →The Strong Dollar Regime: Structural Mechanisms and Market Transmission
The US dollar's persistent strength is not the result of a cyclical exuberance: it reflects a structural reconfiguration…
Weak or Strong Euro: Imported Inflation and Competitiveness
The euro's level acts on the area's economy through two opposing channels: it changes the price of imports,…
How to Read EUR/USD: What Moves a Currency Pair
EUR/USD is the price of one euro expressed in dollars: when it reads 1.14, one euro trades for…