
Middle East Energy Risk: When the Premium Moves From Shipping Routes to Price
The Red Sea crisis of 2024 was paid for in freight, Hormuz in 2026 by the barrel: what moves risk into the oil price is whether there is another way round.

Geopolitical risk in the Middle East does not always reach the oil price. While an alternative route exists, it is paid for in freight, insurance and delays. When there is none, it is paid for by the barrel.
The Red Sea in 2024 and the Strait of Hormuz in 2026 supplied the two cases in almost pure form, two years apart.
TL;DR
Whether a crisis moves from freight rates to the price of a barrel depends on one thing: whether there is another way round.
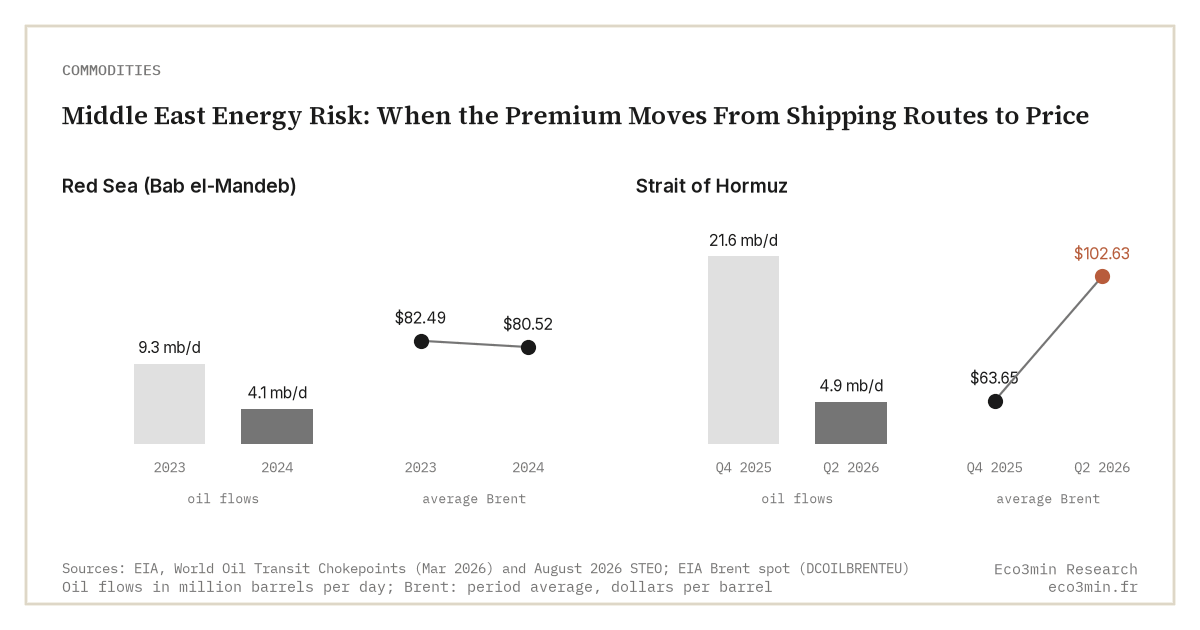
- Red Sea: flows through Bab el-Mandeb fell from 9.3 to 4.1 million barrels a day between 2023 and 2024 (EIA), and Brent’s annual average fell too, from $82.49 to $80.52.
- Hormuz: 20.9 million barrels a day in the first half of 2025 against about 4.7 million of pipeline bypass capacity; flows dropped to 4.9 in the second quarter of 2026.
- Brent went from $71.32 on February 27, 2026 to $138.21 on April 7.
Two ways to pay for a risk
A conflict that threatens a major sea lane can reach the economy through two channels. The first is logistical. Ships divert, voyages lengthen, insurance premiums and freight rates rise, and cargoes arrive later. Oil keeps arriving, at a higher cost to move. The second is physical. Part of supply can no longer reach the market, and the price has to rise until demand falls back or inventories step in.
Until 2025, the dominant reading treated the first channel as the normal shape of geopolitical oil risk: markets that jolt, then get used to it. That was right for the Red Sea. Hormuz proved it wrong, and the difference comes down to a single parameter.
A strait you can sail around costs freight. One you cannot costs price.
The Red Sea: a risk that was routed around
From late 2023, Houthi attacks on commercial shipping emptied the Bab el-Mandeb strait. According to the Energy Information Administration’s World Oil Transit Chokepoints page, oil flows through it fell from 9.3 million barrels a day in 2023 to 4.1 million in 2024. Cargoes went round the Cape of Good Hope, which still carried 9.1 million barrels a day in the first half of 2025.
The price did not follow the map. Brent spot averaged $80.52 a barrel in 2024, against $82.49 in 2023, according to the EIA’s DCOILBRENTEU series. The crisis cost weeks at sea and freight, not barrels. Africa offered a route that was longer but open.
Hormuz: a risk with no way round
The Strait of Hormuz offers no such option. The EIA counted 20.9 million barrels a day through it in the first half of 2025, about 20% of global petroleum liquids consumption. Against that flow, the pipelines that avoid it, Saudi Arabia’s East-West line to the Red Sea and the UAE’s Abu Dhabi pipeline, offer about 4.7 million barrels a day of capacity. Four barrels in five have no other path.
After military action on February 28, 2026, the EIA described the strait as effectively closed to most shipping in its March Short-Term Energy Outlook. Flows through Hormuz averaged 4.9 million barrels a day in the second quarter of 2026, against 21.6 in the fourth quarter of 2025, according to the August STEO. Gulf producers shut in as much as 10.9 million barrels a day of output in May. Brent, at $71.32 on February 27, reached $138.21 on April 7.
This time the risk went into the price because it had nowhere else to go. Insurance and freight jumped as well, but they could no longer absorb the shock: there was no longer a voyage to lengthen.
Measuring a strait’s risk by the size of its flow. Bab el-Mandeb carried 9.3 million barrels a day in 2023, nearly half of Hormuz, and its near-desertion did not lift Brent. What matters is the flow with no alternative: volume minus bypass capacity.
What is left of the logistics channel in 2026
The first channel has not vanished. It has moved. Part of Saudi exports now runs through the East-West pipeline and comes out in the Red Sea, so flows through Bab el-Mandeb rose to 8.1 million barrels a day in the second quarter of 2026, from 5.4 in the fourth quarter of 2025 (August STEO). The route bypassed in 2024 became the emergency route of 2026, which makes it a new vulnerability. The September 2026 attacks on the East-West pipeline, which had carried more than 5 million barrels a day before them according to the EIA, sent Brent back to $130.80 on September 15.
Spare production capacity plays the same role as a spare route. OPEC held 3.02 million barrels a day of it in the fourth quarter of 2025. That fell to 0.02 from the second quarter of 2026, according to table 3d of the October STEO, since almost all of it sat precisely behind the closed strait.
What would weaken this reading
Three developments would qualify it. The second UAE bypass pipeline, of about 1.5 million barrels a day and expected in 2027 according to the EIA, would shrink the share of flow with no alternative. A durable, verified reopening of Hormuz would give the logistics channel back its role as a shock absorber. And the 400 million barrels of emergency stocks that International Energy Agency members agreed to make available on March 11 show that a public stockpile can stand in for a route, for a while.
The indicator to watch is therefore the gap between a passage’s flow and its bypass capacity, more than the count of incidents. For how an oil shock then feeds into activity, see the analysis of WTI as a macro signal of the cycle.
Last updated — 8 October 2026
Disclaimer – Financial and Legal Information: The analyses, commentary, and content published on eco3min.fr are provided for informational and educational purposes only. They do not constitute investment advice or a solicitation to buy or sell financial instruments. Past performance is not indicative of future results. All investment decisions involve risk and are the sole responsibility of the reader. Data, charts and calculated series are provided as is and may contain errors or lag behind their source: check any figure against the primary source cited before relying on it. Content describing laws, regulations or contracts reflects the law as of its publication date and does not constitute legal or tax advice; applying it to a specific situation requires a qualified legal or tax professional.
Read next
Full pillar →WTI: Reading Crude Oil Price as a Macro Signal of Economic Cycles
WTI, the U.S. barrel priced at Cushing, is not just a price — it is a macroeconomic barometer…
Pure-play refiners versus integrated majors: downstream margin exposure
A pure-play refiner owns only the downstream, so its earnings track the refining margin. An integrated major also…
Jet fuel, the forgotten margin: the jet crack and the aviation link
The 3-2-1 crack spread reduces the refining margin to two products, gasoline and diesel. Jet fuel sits outside…