
Copper vs Industrial Metals: What the Divergence Reveals About the Cycle Signal

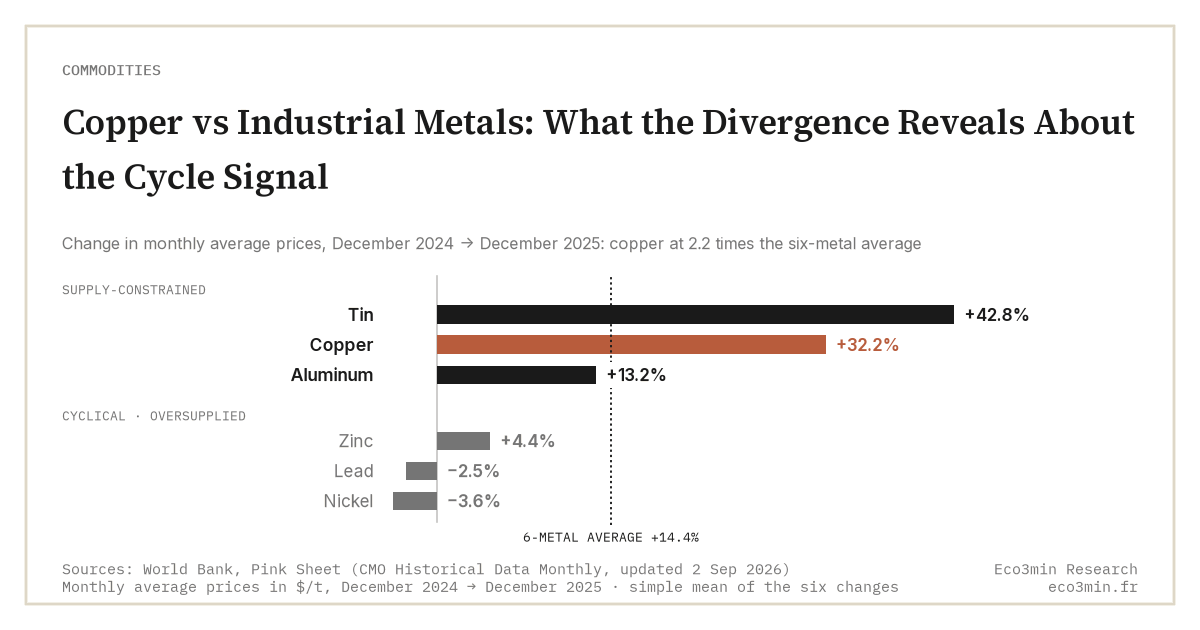
Comparing copper with the other base metals clarifies what its price should really say. In 2025 the complex rose together, but copper nearly doubled the average gain: that dispersion isolates the non-cyclical part of its rise.
TL;DR
Across the base-metals complex, 2025 split two families: supply-constrained copper and tin pulled well ahead of abundant nickel and lead, whose prices lagged despite solid demand.
- The LME composite of the six metals gained roughly 19% in 2025 (Barchart data); three-month copper rose about 41.7%, to $12,423 a tonne at year-end and an intraday record of $14,527.50 on 29 January 2026.
- A Reuters analyst poll in early 2026 put median gains near 20% for copper, 16% for tin and 12% for aluminum, against only 4% to 5% for nickel, lead and zinc.
- Nickel makes the asymmetry plain: despite battery-grade demand from electric vehicles, expanding Indonesian output erased its electrification premium, so strong demand did not lift the price.
A global industrial cycle lifts all metals; it does not make one outperform. The gap between copper and its peers then becomes a test of what, in its price, is cyclical and what is something else.
Why compare copper with its peers
The base metals — copper, aluminum, zinc, nickel, lead, tin — share much of their drivers. They respond to the global industrial cycle, to the dollar and to inflation, so a cyclical pickup tends to lift them together. It is this common response that makes copper a growth gauge: when activity accelerates, its demand rises like its neighbors’. But that property has a flip side: if copper merely tracked the complex, its move would say nothing beyond the cycle. It is precisely when it diverges that it becomes worth isolating. Related coverage: how commodities flag the macro regime.
The comparison therefore works as a test. A rise shared by all metals points to a common — macroeconomic — factor. A rise concentrated in copper points to a factor specific to it: mine deficit, electrification intensity, regulatory tension. That distinction feeds what the copper-gold ratio measures, of which copper is the numerator, and connects more broadly to how commodity cycles feed the macro picture. Reading copper against its peers, rather than alone, separates what speaks to the cycle from what speaks to the metal.
This grid applies directly to the copper-gold ratio. If the numerator — copper — rises for reasons specific to its market rather than from the strength of global demand, the ratio records a growth signal that does not really exist. Isolating copper’s idiosyncratic component thus amounts to measuring the share of the ratio that no longer says anything about the cycle. The wider context: the copper-gold gauge of bond yields.
A rising complex, but a telling dispersion
The base-metals complex did rise in 2025. Per London Metal Exchange market data compiled by Barchart, the composite index of the six metals gained roughly 19% over the year, carried by the electrification and artificial-intelligence narratives and by a weaker dollar. At this stage nothing sets copper apart from a broad move. The difference lies in the scale: LME three-month copper jumped about 41.7% in 2025, settling at $12,423 a tonne at year-end, before reaching an intraday record of $14,527.50 on 29 January 2026. Copper did not merely take part in the rally: it doubled it. World Bank (Pink Sheet) monthly average prices show the same ranking between December 2024 and December 2025: +42.8% for tin, +32.2% for copper, +13.2% for aluminum and +4.4% for zinc, against −2.5% for lead and −3.6% for nickel; copper comes in at 2.2 times the six-metal average (+14.4%). It is this outperformance, not the absolute level, that the copper price path makes visible against its neighbors’.
Expectations extend the dispersion. The Reuters analyst poll published in early 2026 expected, at the median and relative to 2025 average prices, gains on the order of 20% for copper, 16% for tin and 12% for aluminum, against only 4% to 5% for nickel, lead and zinc. The hierarchy is not random: it sets supply-constrained metals against those where supply is catching up. Setting aluminum price history, the zinc price series and nickel price history against copper’s makes that gap concrete, where an aggregate index would hide it.
Tin illustrates the same logic at the extreme. A soldering metal essential to electronics, it too set a record — around $59,040 a tonne on the LME in early 2026 — against fragile supply, with Myanmar’s mining recovery stalled and Indonesia imposing regulatory constraints. That copper and tin, two tight-supply metals, lead the rise while the abundant metals lag confirms that the supply constraint, not cyclical demand alone, structures the complex’s performance.
Two families: supply-constrained, or cyclical and oversupplied
Behind the dispersion sit two families. On one side, the metals whose supply struggles to keep up: copper, tin and, to a lesser degree, aluminum, supported by structural constraints. On the other, the metals where supply exceeds or catches demand: nickel, zinc and lead. Whether a metal sits on one side or the other depends less on geology than on who refines it, a dependence at the heart of the way politics shapes critical mineral chains. Nickel is the telling case — despite robust demand for battery-grade nickel in electric vehicles, the expansion of Indonesian output has weighed on prices, to the point that the metal has lost much of its electrification premium. Demand can be strong without the price rising, once supply is abundant. That asymmetry shows why copper’s structural demand does not translate the same way from one metal to the next.
Zinc and lead complete the picture. Zinc, tied to construction and galvanizing, defied bearish expectations in 2025, but analysts expect for 2026 a stabilization, even slight downward pressure, as higher mine output turns into refined metal. Lead looks clearly oversupplied — high stocks in LME warehouses — and faces a structural headwind: the shift to electric vehicles reduces reliance on lead-acid batteries. These divergent paths reflect a simple reality: markets now differentiate metals by whether they are governed by a durable supply constraint or by cyclical and inventory factors. The silver market offers a point of comparison, treated in how electronics and electric vehicles consume silver.
Aluminum holds an instructive middle position. Its demand has proved robust, but because its production is highly energy-intensive, its price stays sensitive to energy shocks — notably Middle East developments in 2026. Its rise thus blends a demand factor and an input-cost factor, where copper’s owes more to ore scarcity. Comparing the two is a reminder that the same label — ‘transition metal’ — covers distinct price mechanics depending on each market’s structure.
What the divergence says about the copper signal
The lesson for copper is twofold. Part of its rise is shared with the whole complex: the cyclical and macroeconomic component, the one that justifies its reputation as a barometer. But another part — its outperformance against the cyclical metals — is idiosyncratic: it stems from mine scarcity, copper’s intensity in the transition and in artificial intelligence, and regulatory distortions such as the anticipation of US tariffs. It is this second component that dilutes the metal’s signal value: a price driven half by copper-specific forces no longer reports cleanly on the global cycle, and skews the copper-gold ratio accordingly. Eco3min explores this further in the relative read of iron ore and copper.
Financialization sharpens the divergence. Investment flows concentrate on the favored themes — electrification, artificial intelligence — and tilt toward the metals that embody them, copper first among them. In narrow physical markets, these flows can amplify price gaps well beyond what current fundamentals alone would justify. Copper’s outperformance therefore embeds a positioning premium, distinct from its real demand, which further complicates reading the price as a reflection of the cycle.
Part of the market consensus reads the complex’s rise as confirmation of solid growth. The divergence qualifies that read without erasing it: the broad move does carry cyclical information, but copper’s premium over its peers comes from supply and the transition. Several forces could narrow the gap. Analysts note a growing tension between the financial sphere and the real economy: investment flows can propel narrow physical markets, but too high a price eventually triggers material savings, substitution and a pullback in demand. base-metal supercycle precedents are a reminder that these corrections, slow as they are, do arrive, and that extrapolating the outperformance in a straight line would be unwise.
For copper to regain a clean cyclical read, its cyclical demand would have to clearly retake the lead over its transition demand, and supply would have to ease. As long as the mine deficit and electrification intensity dominate, the gap with the cyclical metals should persist, and with it the share of the price that escapes the cycle. Tracking that gap over time — rather than copper’s level alone — offers a more honest gauge of what the metal is actually saying at any given moment.
- In 2025, the entire base-metals complex rose (LME composite index around +19%), but copper outperformed with a gain close to +41.7%.
- The dispersion sets two families apart: supply-constrained metals (copper, tin, aluminum) and cyclical or oversupplied metals (nickel, zinc, lead), with markedly more modest paths.
- Nickel shows that strong demand does not lift the price when supply is abundant: Indonesian expansion erased its electrification premium.
- Copper’s outperformance over its peers isolates its non-cyclical component — supply, transition, tariffs — which dilutes its signal value and that of the copper-gold ratio.
Comparing copper with its neighbors does not settle where its price is heading, but it clarifies what it measures. The same move can be cyclical across all metals and structural in copper alone; telling those two strata apart, rather than reading an aggregate index, remains the condition for a fair interpretation. The divergence is not a flaw in the signal: it is its most instructive part.
Frequently asked questions
Did copper outperform the other base metals in 2025? Yes. The LME base-metals composite index gained roughly 19% over the year, while three-month copper rose about 41.7%, nearly double the complex average.
Why did nickel not follow despite battery demand? The expansion of Indonesian output created a surplus that weighed on prices, showing that strong demand only supports the price if supply stays constrained. A complementary angle: the structural fragility of the nickel market.
What does the gap between copper and its peers reveal? It separates the cyclical part of its rise, shared with the whole complex, from its idiosyncratic part — mine supply, electrification, tariffs — which does not report on the global cycle.
Last updated — 7 October 2026
Disclaimer – Financial and Legal Information: The analyses, commentary, and content published on eco3min.fr are provided for informational and educational purposes only. They do not constitute investment advice or a solicitation to buy or sell financial instruments. Past performance is not indicative of future results. All investment decisions involve risk and are the sole responsibility of the reader. Data, charts and calculated series are provided as is and may contain errors or lag behind their source: check any figure against the primary source cited before relying on it. Content describing laws, regulations or contracts reflects the law as of its publication date and does not constitute legal or tax advice; applying it to a specific situation requires a qualified legal or tax professional.
Read next
Full pillar →The Copper-Gold Ratio as a Macro Signal: Still a Reliable Gauge of Treasury Yields in 2024-2026?
The copper-gold ratio pits a growth metal against a safe haven, and for years it tracked the 10-year…
Pure-play refiners versus integrated majors: downstream margin exposure
A pure-play refiner owns only the downstream, so its earnings track the refining margin. An integrated major also…
Jet fuel, the forgotten margin: the jet crack and the aviation link
The 3-2-1 crack spread reduces the refining margin to two products, gasoline and diesel. Jet fuel sits outside…