
Protecting Savings From Inflation: What Has Worked, and in Which Regime

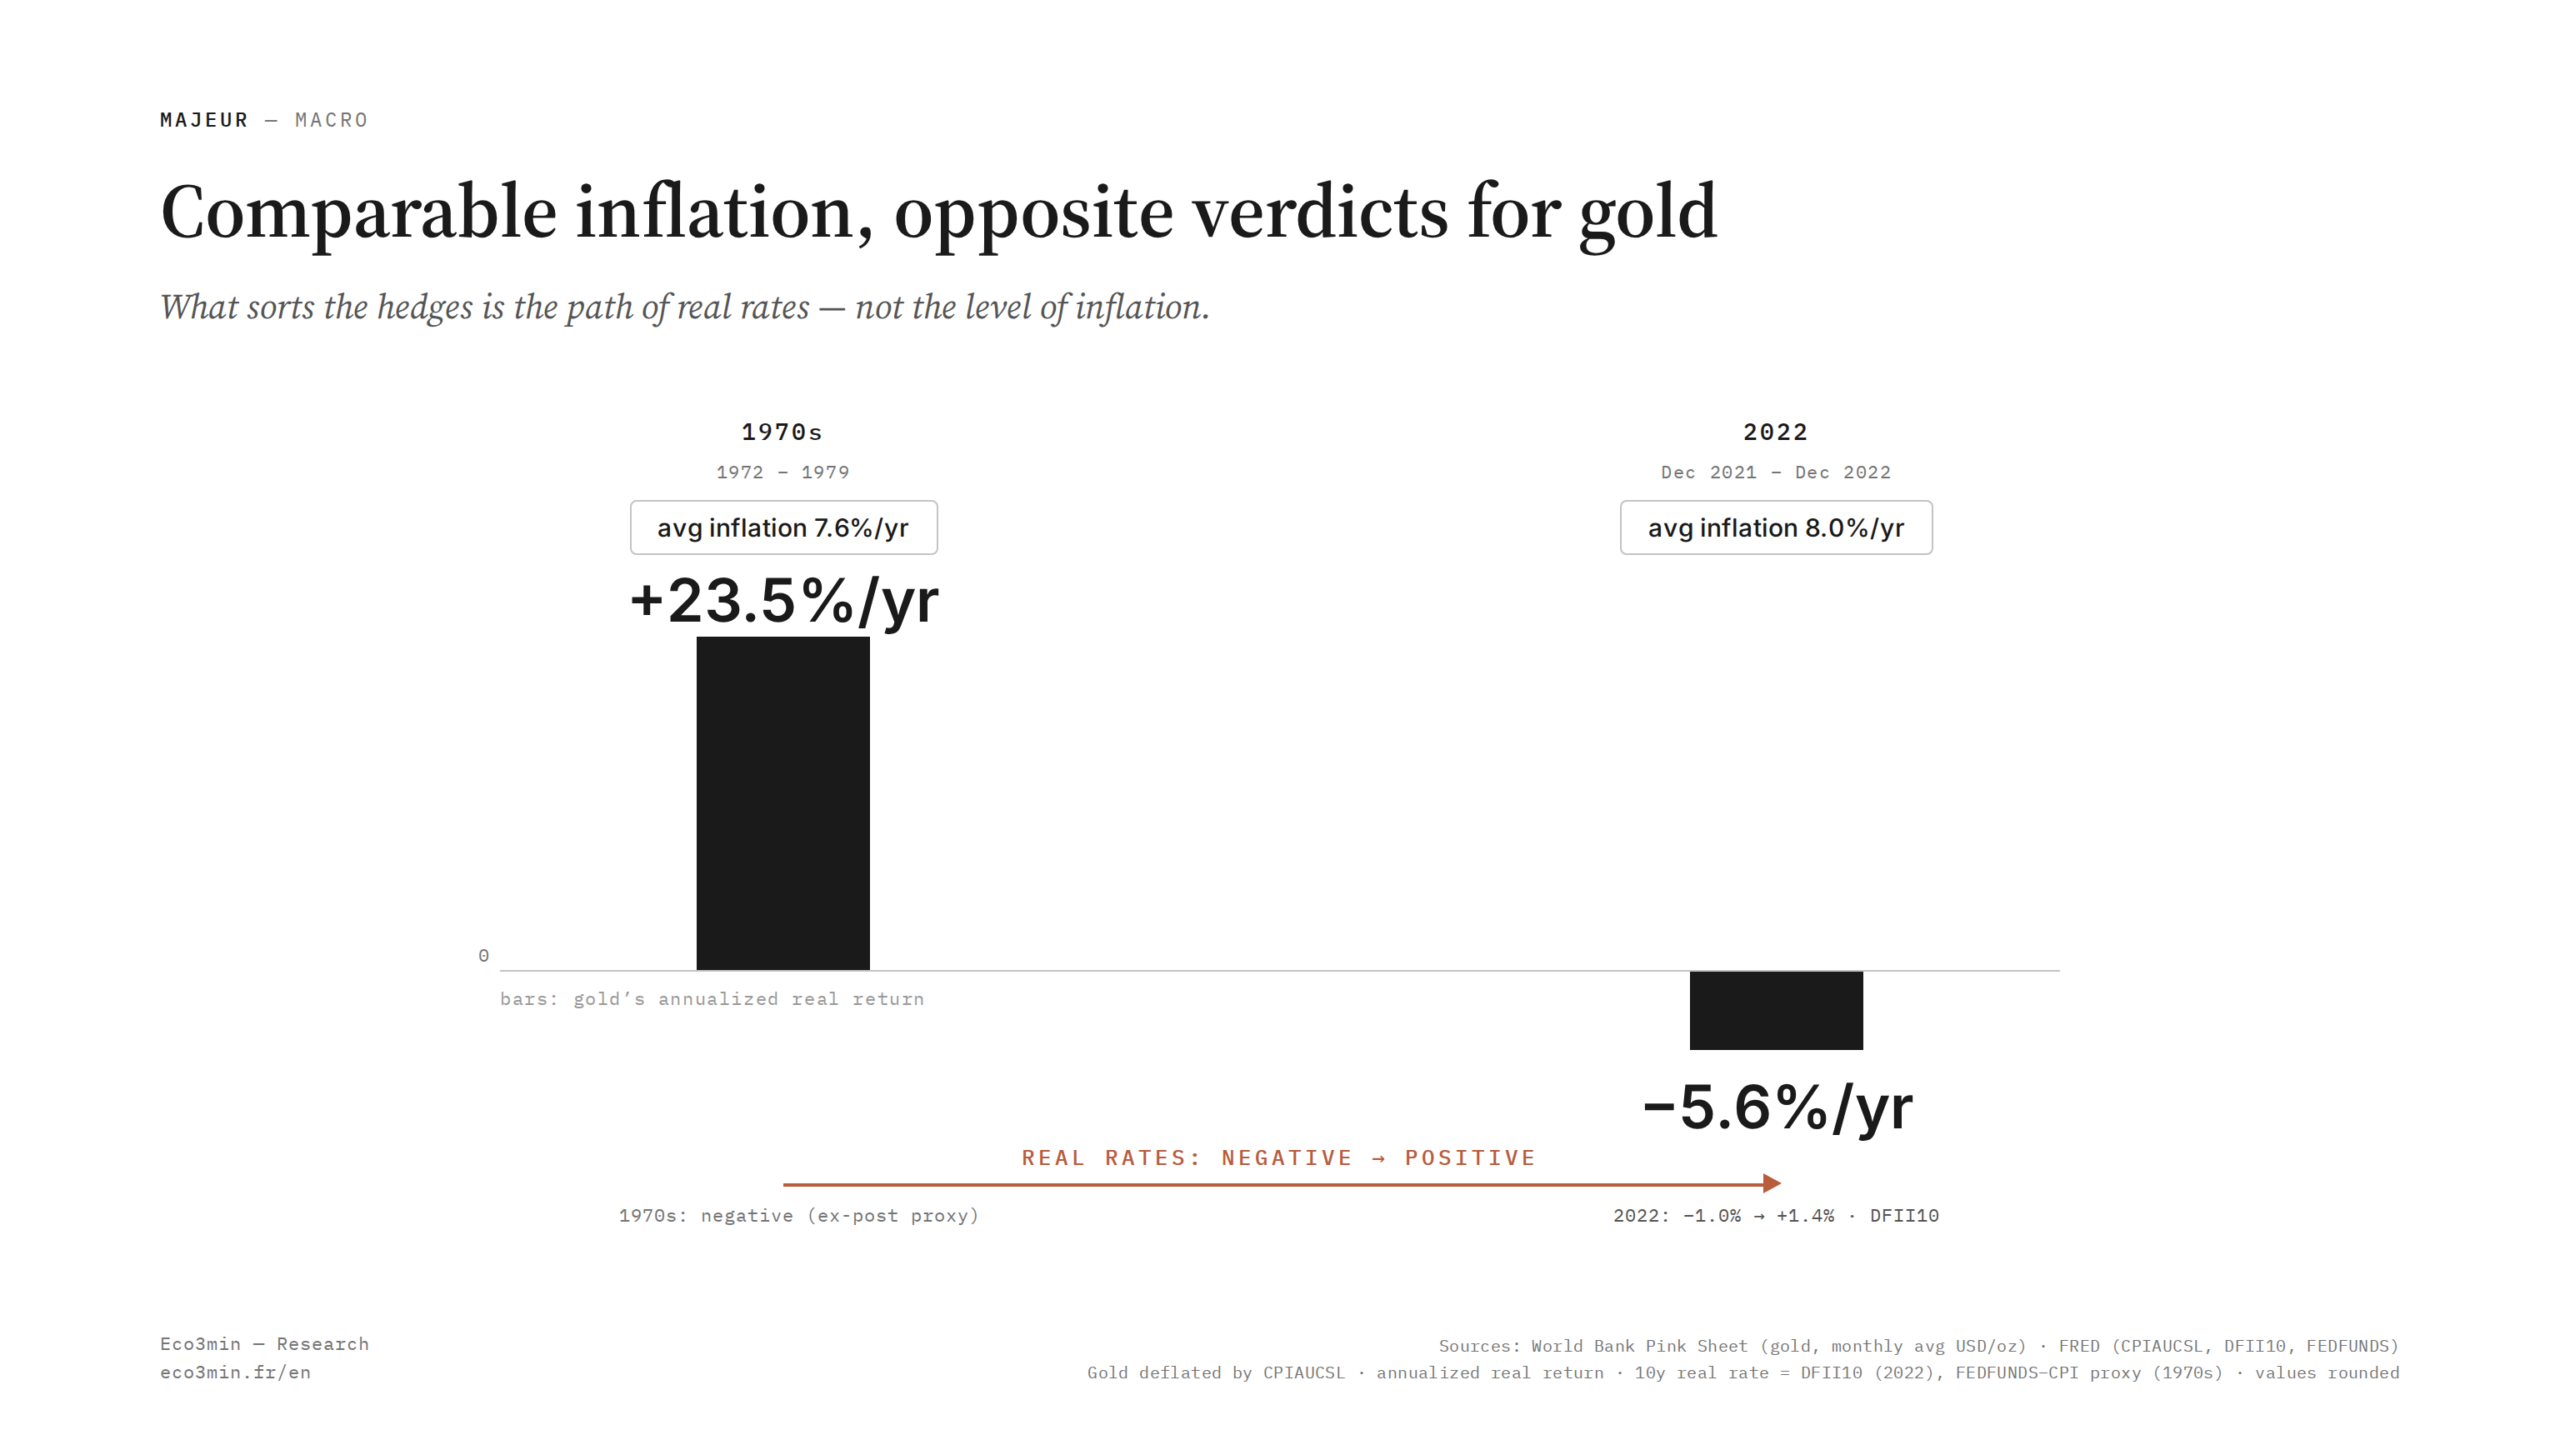
No asset has protected savings across every inflationary episode: what held depended less on the rise in prices itself than on the regime driving it and the path of real rates that came with it.
TL;DR
"Protecting savings from inflation" actually means three different goals that get conflated: preserving nominal capital, preserving purchasing power, and beating it, each served by different assets in different regimes.
- "Real assets" is not one defense: gold reprices almost immediately with expected real rates, commodities track the supply shock more than the rate path, and property reprices with the longest lag.
- In the 1970s, US CPI rose from about 3% in 1972 to above 12% in 1974 and peaked near 15% in early 1980 (BLS); nominal rates stayed below inflation, real rates were negative, and real assets were rewarded.
- A capital guarantee can be the surest vehicle of a real loss: savings whose nominal value never moves lose purchasing power whenever inflation runs above the credited rate.
The question “how do you protect savings from inflation?” usually invites a list of assets. This page replaces that list with a reading grid by regime, and routes to the asset-by-asset analysis.
The myth of the all-weather hedge
The most common answer to monetary erosion is an inventory: gold, property, inflation-linked bonds, sometimes equities. Presented as a kit that works in all conditions, this list carries a flaw that long data series expose without ambiguity. None of these assets protected savings in every inflationary episode of the past fifty years. Each had its strong decade and its lost decade, and the order in which those phases followed one another was anything but random.
Gold offers the clearest illustration. After the end of dollar convertibility in August 1971, its price rose from 35 dollars an ounce to a peak near 850 dollars in January 1980 (LBMA data), one of its strongest real decades, against a backdrop of oil shocks and durably negative real rates. The following decade reversed the verdict. From the 1980 high to the late 1990s, gold lost 70% of its nominal value, from the 850-dollar high at the London fixing to a 256-dollar trough reached in July 1999, even as the US economy went through a long disinflation. Measured on monthly averages, which smooth the January 1980 peak to 675 dollars, the fall is still 62%. The metal had not changed in nature. The regime had.
Inflation-linked bonds tell another version of the same misunderstanding. Built to neutralise the price component, since the principal of US TIPS, like that of euro-area linkers, reprices on the consumer price index, they protect the indexation, not the rate risk. The spread these instruments imply against nominal Treasuries is unpacked in TIPS and breakeven inflation. When real rates rise, the market value of a long inflation-linked bond falls, regardless of the fact that it keeps tracking inflation faithfully. The saver who bought a linker at the 2022 inflation peak, believing they had locked in protection, often recorded a market loss when inflation receded and real rates moved back into positive territory. The hedge worked on the axis it was built for, and disappointed on the one wrongly attributed to it.
The point holds for the assets reputed to be the most solid. Physical real estate, often presented as a natural hedge because its rents partly index to prices, went through marked real declines whenever real rates rose quickly, irrespective of the inflation path. Equities, supposed to pass inflation into nominal earnings, stagnated in real terms for an entire decade in the 1970s, at the very moment a hedge was expected of them. The regularity of these failures is not anecdotal. It traces a pattern.
The saver’s consensus, that inflation hedges exist, is therefore not false, it is incomplete. It omits the variable that separates one episode from another. The thesis of this page is deliberately narrow: there is no all-weather hedge, and believing otherwise amounts to confusing the long-run average with the performance in a specific regime. The fifty-year average masks opposite paths across decades. It is precisely in those paths that the real protection of savings plays out, and it is there that investment strategies across regimes are built.
Three objectives confused under one word
Before assets even enter the picture, part of the misunderstanding lies in the question itself. “Protecting savings from inflation” actually covers three distinct objectives, which call for different answers and are regularly conflated.
The first objective is to preserve nominal capital: not to watch the balance fall in dollars or euros. This is what guaranteed deposits and capital-protected savings serve, and it is the one inflation leaves intact in appearance, since the figure on the statement does not drop. The second objective is to preserve purchasing power: that a hundred units of savings buy tomorrow what they buy today. This is a more demanding goal, one that a nominal guarantee does not reach, since inflation silently erodes the real value of a capital that is nonetheless guaranteed in nominal terms. The third objective, more ambitious still, is to beat inflation: to grow purchasing power beyond mere conservation, which requires a positive real return and therefore risk-taking.
These three objectives do not rank against one another, because they do not aim at the same thing. An asset can serve the first and betray the second, as a guaranteed deposit does in a high-inflation regime. Another can serve the third in some regimes and inflict a nominal loss in others, as risk assets do. The common error is to judge an investment “good” or “bad” against inflation without specifying which of the three objectives is pursued. The answer changes entirely with the objective, and it changes again with the regime. This page deals mainly with the second and third objectives, preserving or growing purchasing power, because those are the ones the standard hedge list claims to serve, and the ones regimes separate.
The distinction carries a practical consequence that is often missed: a capital guarantee, far from being synonymous with safety, can be the surest vehicle of a real loss. Savings whose nominal capital never moves mechanically lose purchasing power whenever inflation runs above the credited rate. Perceived safety and real protection coincide only in the regime where the nominal return covers inflation, a regime that is neither permanent nor guaranteed.
Horizon adds a third dimension to the confusion. The same asset does not serve the same objective whether held for one year or twenty. Equities, a poor hedge over one year in a cost-push inflation, become an imperfect but positive real hedge over horizons beyond fifteen years, because the pass-through of inflation into nominal earnings eventually outweighs the initial multiple compression. Conversely, interest-bearing cash protects purchasing power in the short run in a regime of high short rates, but grows it over the long run in no regime at all. Judging a hedge without specifying either the objective or the horizon compares answers to different questions.
What decides is not inflation, but the regime
“Inflation” is not a single variable on which a hedge could be set once and for all. It is a phenomenon with several faces, and the protection that holds varies with the face. Two axes are enough to organise this diversity, and they structure the whole analysis that follows.
The first axis sets cost-push inflation against demand-pull inflation. Cost-push inflation arises from a supply shock: the 1973 energy surge, the 2021 logistics breakdown. Prices rise because producing costs more, even as demand may weaken. Demand-pull inflation arises from an excess of purchasing power over productive capacity, classically overheating. Both carry the same name in the statistics, but they do not reward the same assets, because they do not call for the same monetary response. The decomposition of US inflation into a supply component and a demand component carried out by the Federal Reserve Bank of San Francisco over 2021 to 2024 showed a dominant supply share early in the episode, then a gradual shift, and with it a displacement of what protected.
The second axis sets transitory inflation against persistent inflation. A transitory burst fades on its own without a strong monetary reaction. A persistent regime anchors expectations and eventually calls for durable tightening. The nuance is not semantic: it governs the rate path, hence the real return of each protection. The fine mechanics of these types, how they form, how they are told apart in real time, what the supply and demand decompositions say month after month, belong to a dedicated treatment. What matters here is their translation into a protection grid.
From these two axes comes the notion of inflation regime: the combination of the nature of the shock and the monetary response it triggers. The same inflation figure, say 8 percent, does not mean the same thing depending on whether it accompanies negative real rates held for a long time or an abrupt tightening that pulls real rates back into positive territory. It is the inflation regime that decides the ranking of protections, far more than the nominal level of the rise in prices.
One reading of the collective error of 2021 and 2022 lies in this confusion. The shared diagnosis, “high inflation,” was right on the level and silent on the regime. Savers who reasoned by analogy with the 1970s, moving into gold and real assets, bet on a regime of prolonged negative real rates. They met the opposite: the fastest monetary response since the Volcker era. The bet on the asset was coherent. The implicit bet on the regime was not. The lesson is less “they picked the wrong asset” than “they misread the regime.”
The path of real rates separates the protections
If a single mechanism had to summarise why protections diverge from one regime to another, it would be this: nominal inflation does not separate the assets, the path of real rates that accompanies it does. The real rate, the nominal rate adjusted for expected inflation, is the relative price between holding interest-bearing cash and holding an asset. When that price changes sign, the hierarchy of protections reverses. This single mechanism plays out through as many channels as there are asset classes, but it is the same spring acting in each.
One clarification is needed on what is meant by the real rate, because it conditions everything else. The real rate relevant to markets is computed with expected inflation, not inflation already realised. It is the gap between a bond’s nominal yield and the inflation breakeven, the inflation the market anticipates, that determines the real return demanded. This nuance explains a puzzling fact: protections can reverse before realised inflation even changes course, as soon as expectations move. In 2022, part of the disappointment in gold and long bonds came from the rise in expected real rates, ahead of the actual decline in inflation. The market does not react to yesterday’s inflation but to the inflation it projects, and it is on that projection that the real-rate path separating assets forms. On the same theme: how stocks and bonds compare.
The first channel is the opportunity cost of non-yielding assets. Gold makes this channel transparent. It pays no coupon, no dividend, no rent. Holding it carries an opportunity cost equal to the real return given up by not placing the same sum in bonds. When real rates are deeply negative, that opportunity cost is nil, even negative: receiving nothing beats receiving a real return below zero. Gold then becomes a credible competitor to government debt. When real rates turn positive again, the calculation reverses: giving up a positive real return to hold a sterile asset has a cost, and demand erodes. It is gold’s role across real rates that explains its alternation of strong and lost decades, far better than its reputation as a timeless safe haven.
The second channel is duration risk on fixed income. A fixed-rate bond loses market value when rates rise, and the size of the loss grows with duration. In 2022, the fastest tightening since the early 1980s inflicted on long sovereign bonds one of their worst years in real terms since the series began. Inflation-linked bonds did not escape it: their indexation faithfully tracked the rise in prices, but their real-rate component fell as real yields climbed. The distinction between protecting indexation and protecting against rate risk is exactly what inflation-linked bonds by rate regime covers: a short linker and a long linker do not travel through the same regime in the same way, because they do not carry the same duration.
The third channel is the discount rate on property income. Real estate assets draw part of their value from future rents discounted at a rate that embeds real rates. When real rates rise, the discount rate rises, and the present value of future rents falls, even if nominal rents grow with inflation. The lag comes from the fact that rent revaluation and rate repricing are not synchronous: the first follows realised inflation, the second anticipates monetary policy. This desynchronisation is at the heart of listed property through the rate cycle, where it shows up in market prices before it shows up in income, and explains how an asset with indexed rents can lose value at the very moment its income rises.
The fourth channel concerns equities, whose ambiguous position the real-rate grid helps clarify. Over the long run, firms partly pass inflation into selling prices and nominal earnings, which makes equities an imperfect but real hedge over long horizons. In the short run, in a cost-push inflation accompanied by tightening, two forces stack up: margin compression, when costs rise faster than selling prices, and the higher discount rate on future earnings, which weighs all the more on valuations the more distant the expected growth. Equities can then fall in real terms at the very moment a hedge is expected of them. This is the meaning of the 1970s paradox, examined below.
The weak signal this grid foregrounds is less discussed than the inflation level itself: the slope of the term premium and the speed at which real rates reprice matter more, for the ranking of protections, than the inflation peak reached. An episode of strong inflation accompanied by real rates held negative does not produce the same scoreboard as a comparable episode followed by an abrupt tightening. The level is visible. The path of real rates decides. Companion dataset: our term-premium data series.
The same mechanism exposes a second coarse category, the one that pairs the standard list: “real assets.” Gold, commodities and property are routinely bundled as a single inflation defence, yet they answer to the real-rate path on different timetables. Gold reprices almost immediately with expected real rates, because its only valuation anchor is the opportunity cost. Commodities track the inflation shock itself more than the rate path, so they can rise with a supply-driven inflation even as real rates climb. Property reprices with the longest lag, since rents adjust slowly and transactions are infrequent. Lumping the three under “real assets” hides exactly the timing differences that decide whether each protects in a given regime, just as “inflation hedge” hides the differences between assets.
Four historical regimes, read by protection
The best way to verify that the regime trumps the asset is to reread several episodes side by side, not by their inflation level but by the real-rate path that accompanied them. The scoreboard of protections changes each time, and it changes in the direction the preceding mechanism predicts.
The 1970s: negative real rates, real assets rewarded
The decade that followed the end of Bretton Woods combined two oil shocks, in 1973 and 1979, and a monetary response long behind inflation. The US consumer price index, according to the Bureau of Labor Statistics, rose from around 3 percent in 1972 to above 12 percent in 1974, then peaked near 15 percent in early 1980. For most of the period, nominal rates stayed below inflation: real rates were negative. In this regime, real and non-yielding assets protected, because the opportunity cost of holding them was nil. Gold posted its strongest real decade. Commodities and physical property repriced higher. US equities, by contrast, stagnated in real terms over the decade: the compression of valuation multiples erased the growth in nominal earnings. This is the regime the collective imagination associates with “inflation,” and it is the source of the standard hedge list. Everything that follows shows that it is only one regime among several.
The scale of the divergence within that regime is worth stressing, since it underpins the later misunderstanding. While gold multiplied its real value, the broad US equity indices ended the decade at roughly the same nominal level as they began, a heavy real loss once inflation is deducted. Two assets both reputed to hedge inflation thus met diametrically opposite fates in the same regime. The lesson is not that gold protects and equities do not, the next disinflation would reverse that verdict, but that the category “inflation hedge” is too coarse to be operative. It lumps together assets whose behaviours diverge radically as soon as the regime and the horizon are specified.
The Volcker disinflation: positive real rates, the verdict flips
Paul Volcker’s arrival at the head of the Federal Reserve in 1979 opened the opposite regime. The policy rate was pushed to nearly 19 to 20 percent in 1981 (FEDFUNDS series, FRED), well above inflation: real rates turned strongly positive. Inflation was broken within a few years. The scoreboard reversed point by point. Gold, stripped of its support, entered a long decline that would last two decades. Bonds, whose high nominal yields combined with a disinflation that lifted real coupons, began one of their longest bull markets. Equities, freed from multiple compression, did the same. The protection that had dominated the 1970s became the loser of the 1980s, without any intrinsic property of gold having changed. Only the sign of real rates had changed. The episode is the decisive counterexample to the standard list: the same decade that crowned gold dethroned it the moment the regime turned. The bond bull market that began in the early 1980s ran for close to four decades, the mirror image of gold’s two lost decades, both governed by the same positive-real-rate regime that the disinflation installed.
2008 to 2020: the long parenthesis of compressed real rates
The 2008 financial crisis is a reminder, first, that a hedge against inflation is not a hedge against every regime. The shock was deflationary: collapsing demand, contracting credit, inflation expectations falling away. The Federal Reserve cut its policy rate to zero. In this regime, cash and long sovereign bonds of the best signature protected, because they gained value as rates and inflation expectations fell. Gold first declined in the general liquidation, before rebounding when asset-purchase programmes fed fears of future inflation. In the same vein: what the macro regime changes for investments.
A singular decade then opened. From 2009 to 2020, inflation stayed low but monetary policy held nominal rates very low, so that real rates hovered around zero or below, without an inflationary shock to justify them. This durable compression of real rates supported bonds, equities and property at the same time, a rare configuration in which almost everything rose together. The 2020 pandemic shock pushed the regime to its extreme: ten-year inflation-linked yields fell to around minus 1 percent, the most negative real rates in decades, and gold set a nominal record near 2,070 dollars an ounce in August 2020 (LBMA). This parenthesis of deeply negative real rates shaped the reflexes of a generation of savers and set the stage for the 2022 rebuttal.
2021 and 2022: same nominal diagnosis, opposite path
The most instructive episode is the most recent, because it resembles the 1970s in its level and departs from them in its regime. US inflation peaked at 9.1 percent in June 2022 (BLS), a four-decade high. The nominal diagnosis was the same as in 1974. But the monetary response was the opposite of the 1970s: the Federal Reserve raised its policy rate from a 0 to 0.25 percent range in March 2022 to 5.25 to 5.5 percent by mid-2023, at the fastest pace since the Volcker era. Real rates, measured by ten-year inflation-linked yields, moved from around minus 1 percent in 2021 to clearly positive territory by late 2022. The scoreboard followed the real-rate path, not the inflation level, and the chart at the top of this page puts numbers on the gap: at comparable average inflation, 7.6% a year from 1972 to 1979 against 8.0% in 2022, gold returned 23.5% a year in real terms in the first case and lost 5.6% in the second, while the ten-year real yield moved from −1.0% to +1.4%. Gold, expected to be the great winner by analogy with the 1970s, therefore ended 2022 disappointing in real terms. Long bonds, linkers included, posted one of their worst years. Interest-bearing cash, long disdained, became a real investment again once short rates moved above inflation. This reversal of the scoreboard at an identical nominal diagnosis is the empirical proof of this page’s thesis, developed series by series in the comparison of two regimes, opposite winners.
Set end to end, these episodes trace a pattern the standard list does not capture. Two high-inflation regimes, the 1970s and 2021 to 2022, produced opposite winners, because the real-rate path was opposite. Two low-inflation regimes, the Volcker disinflation and the 2009 to 2020 parenthesis, themselves rewarded different assets depending on whether real rates were high or compressed. The inflation level, taken alone, predicts none of these rankings. The sign and the path of real rates predict all of them. That is the central observation of this page: the explanatory variable is not the one the standard list foregrounds. A protection is chosen against a regime, never against “inflation” in general.
The most widespread error is to treat “inflation” as a single regime and to deduce a fixed list of protections. This reading confuses the level of the rise in prices with the path of real rates that accompanies it. Correcting the error means ceasing to ask “which asset hedges inflation?” and asking instead “which real-rate regime am I in, and what has it historically rewarded?”
Why the standard list survives the rebuttals
One question remains: if long data series rebut the all-weather hedge so regularly, why does the standard list, gold, property, linkers, survive in savers’ minds? Three mechanisms explain it, and naming them is part of the protection.
The first is the illusion of the average. Computed over fifty years, gold’s real return is positive, which seems to validate its reputation. But that average aggregates one decade of very strong gains and two decades of decline. Almost no one holds an asset for fifty years, and the real saver meets a regime, not the average of all regimes. The long-run statistic is both true and misleading: true over the theoretical horizon, misleading over the lived one.
The second is recency and analogy bias. The collective memory of “inflation” is largely that of the 1970s, the only prolonged episode the word evokes. When inflation returned in 2021, the reflex was to replay the 1970s scenario, real assets and gold, without checking that the monetary regime was comparable. It was not. Analogy stood in for analysis, and the cost of that substitution showed up in 2022 performance.
The third is the narrative superiority of stories over regimes. “Gold hedges inflation” is a simple, memorable, transmissible sentence. “Gold’s real return depends on the sign and path of real rates accompanying inflation” is not. Simple narratives propagate better than conditional mechanisms, regardless of their validity. That is one more reason to return to the mechanism, not because it is more appealing, but because it is more faithful to what the data show.
A fourth mechanism, more discreet, sustains the standard list: it is commercially useful. A product sells better backed by a simple promise, “hedges inflation,” than by a regime condition. The story of the timeless safe haven lends itself to marketing. The conditional grid, which reminds the reader that an asset can disappoint, lends itself poorly to promotional discourse. Without any deceptive intent at play, the distribution channel therefore selects the most categorical formulations, and the regime context is gradually stripped from the message. The saver receives the conclusion, “this asset protects,” shorn of the condition that makes it true or false. Restoring that condition is not an academic refinement: it is the difference between a protection that holds in its regime and a disappointment programmed in the wrong one. Naming the four mechanisms together, the average, the analogy, the story and the sales channel, does more than explain why the list persists. It inoculates the reader against it, by making the missing regime condition audible behind every categorical claim.
The nominally-anchored family: the conditional baseline
Before any “active” protection, there is a baseline that almost every saver holds: the nominally-anchored family. Regulated savings accounts, deposits, money-market holdings, the euro compartment of life insurance share a property, a guaranteed nominal capital, that makes their real protection entirely regime-dependent. When the credited rate exceeds inflation, the real return is positive. When inflation pulls ahead, the erosion is silent but mechanical. It is exactly the second objective from section 2, preserving purchasing power, that this family serves or betrays depending on the regime. A closer look: the breakdown of American household cash.
The recent record illustrates the point. US and euro-area data show regulated and deposit rates sitting below inflation through most of 2021 to 2023, before crossing back above as policy rates rose and inflation receded. Over that window, savings reputed to be “safe” lost purchasing power in real terms, not for lack of a nominal guarantee, but because the guarantee covered the wrong axis. This family is neither good nor bad: it is the conditional benchmark against which every other protection is judged, which is what nominally-anchored savings detail through the regime.
The benchmark function is worth making explicit, because it reframes every other protection. The real return on interest-bearing cash sets a kind of hurdle rate: any active protection earns its place only by clearing, over the relevant horizon, what a guaranteed nominal instrument would have returned in real terms. In a regime where short rates run well above inflation, that hurdle is high, and the case for taking on the risk of gold, property or long bonds narrows. In a regime of negative real rates, the hurdle is below zero, and the same risk assets face an easier comparison. The nominally-anchored family is therefore not a residual choice. It is the yardstick that makes the others measurable, and it moves with the regime like everything else.
The euro compartment of life insurance deserves a separate mention, because it combines a nominal guarantee with an underlying bond exposure. Its return reacts with a lag to the rate regime: old bond portfolios, with low coupons, slowly dilute new higher-yielding securities, so that the credited rate follows the rise in rates with a delay of several years. This inertia, which protected holders in a low-rate regime, works the other way when rates rise fast, leaving the credited rate behind new market conditions. The detail of this mechanism belongs to euro funds against inflation, covered in the dedicated life-insurance cluster.
The routing table: which analysis for which protection
The role of this page is not to re-instance the analysis of each protection, since each is treated on its own, but to set the grid that says where to look depending on the regime. The logic is constant: each asset class protects in the regime that favours it and disappoints in the one that does not, and the separation runs through the path of real rates. The correspondence below reads not as an “asset to buy” scoreboard, but as a cartography of observed behaviours.
Bonds, linkers included, have historically protected savings in a regime of disinflation and stable or falling real rates, and suffered in a regime of rapidly rising real rates, the distinction between indexation and rate risk being decisive here. Gold has protected in a regime of durably negative real rates and declined when they turned positive again. Listed property has protected income with a lag, but seen its market value reprice before its rents on a rate reversal. Interest-bearing cash, finally, has been a real protection only when short rates exceeded inflation, a regime that occurs but is neither permanent nor guaranteed.
Equities sit across the table rather than in a single cell, which is why they resist the simple hedge label. They have protected purchasing power over long horizons, as the pass-through of inflation into nominal earnings accumulated, and disappointed over short horizons in cost-push regimes, when margin compression and a rising discount rate hit together. Their place in the routing grid is therefore conditional on horizon as much as on regime, a reminder that the same asset can belong to the third objective from section 2, beating inflation, over twenty years while failing the second, preserving purchasing power, over one.
For the asset-by-asset detail, the routing points to the relevant clusters. To understand the formation of inflation itself, upstream of any protection, the reference page remains inflation, explained in full.
This cartography calls for a methodological caution. Reading “this asset protected in that regime” in the past is an observation. Turning it into “this asset will protect” in the future assumes that the coming regime resembles the past one, which is never guaranteed. The map describes historical correspondences, it does not predict the next regime. The whole challenge then shifts to a question of identification: which regime are we in? That is the object of positioning savings by the macro cycle, which extends this page onto the terrain of reading the cycle.
That identification is the hard part, and it would be dishonest to present it as simple. A regime does not announce itself: it is often recognised after the fact, once the real-rate path has already set in. In 2021, the transitory or persistent nature of inflation divided the best-equipped economists for months, and the answer became clear only with the tightening. Reading the regime therefore means watching leading indicators, inflation expectations, the dynamics of real rates, the orientation of monetary policy, while accepting that they deliver only a probability, never a certainty. The protection grid by regime does not remove that uncertainty. It moves it to the right place, by saying: what deserves the analytical effort is not the choice of the protective asset in the abstract, it is the identification of the regime in which that asset will be judged.
Reading protection by regime, rather than by asset, requires three prior readings: the nature of the inflation shock (supply or demand), its likely character (transitory or persistent), and above all the path of real rates the monetary response draws. The first two orient. The third decides. A protection consistent with the nominal diagnosis but inconsistent with the real-rate path exposes to the disappointment observed in 2022.
The limit of the map: the risk of a regime shift
A cartography of protections by regime suffers from a limit that static analyses pass over in silence: regimes change, and a protection set for the regime that has just ended becomes a risk when the backdrop shifts. The danger is less to pick the wrong protection than to keep it beyond the regime that justified it.
Recent examples abound. Inflation-linked bonds bought at the 2022 inflation peak locked in an unfavourable entry point once inflation receded and real rates climbed. Gold accumulated in anticipation of durably negative real rates lost its main support when those turned positive. In both cases, the protection was not bad in itself: it was poorly synchronised with the regime that followed. Regime transitions are rare but abrupt, and that is precisely where “obvious” protections reverse. The cost of mistiming the regime often exceeds the cost of picking the wrong asset, which is what when the regime flips develops further.
The shift has a corollary that savers discover the hard way: correlations between asset classes are not stable from one regime to another. The protection thought to be diversifying, holding both equities and long bonds, rested for two decades on a negative correlation between the two, which reversed in 2022 when both fell together under the rise in real rates. A hedge can therefore stop protecting not because the asset changed, but because its relationship to the other assets changed with the regime.
What makes the shift costly in practice is rarely the analysis, it is the behaviour. A protection that worked through an entire regime accumulates conviction, and conviction is sticky. The saver who was right to hold gold through years of negative real rates has every psychological reason to keep holding it as those rates turn, because the recent record rewards the position. Selling a protection that has just worked feels like abandoning a winner, when the regime has in fact removed its support. The asymmetry is uncomfortable: the discipline a regime shift demands runs against the experience the previous regime just delivered.
This limit does not disqualify the grid. It refines its use. A map of protections by regime is only worth as much as the reading of the transition that goes with it. It says what held in each regime. It does not exempt anyone from the harder question of knowing which regime one is in, and when it changes. It is this honesty about its own limit that separates an analytical grid from a recipe.
There is no all-weather hedge against inflation: it is the path of real rates, not the level of the rise in prices, that separates the protections.
Conclusion
The demand to “protect savings from inflation” is legitimate. The answer in the form of a fixed list is not. Fifty years of long series show a scoreboard that reverses from one regime to another, and the same inflation figure leading to opposite winners depending on the path of real rates. Acknowledging this shifts the question: it is no longer a matter of choosing once and for all the asset reputed to protect, but of specifying which objective is pursued, reading the regime, identifying what it has historically rewarded, and keeping in mind that no past correspondence binds the future if the regime changes. The map of protections by regime is worth something only in the hands of someone who can read which regime they are in, and who stays clear-eyed about the fact that it can shift.
That clarity has a practical virtue: it moves the effort to where it pays. Rather than searching for the perfect protective asset, which exists durably in no regime, it invites the reader to clarify the objective pursued, to identify the regime in progress, and to accept that every protection is conditional and revisable. It is a less comfortable stance than a list, but it has this in its favour: it survives the long series, which no fixed list ever has. That, in the end, is the only promise an honest analysis can keep: not to name the asset that will protect, but to arm the reading of the regime that will judge it.
Frequently asked questions
Is there an asset that protects savings across every inflation regime?
Long series do not allow such an asset to be identified. Over the 1971 to 2023 period, every reputed protection, gold, property, inflation-linked bonds, equities, went through at least one inflationary episode where it fell in real terms. The separation runs through the path of real rates accompanying inflation, not inflation alone.
Why did gold protect in the 1970s and disappoint in 2022, at comparable inflation?
Because the real-rate regime differed. In the 1970s, real rates stayed negative, cancelling the opportunity cost of holding a non-yielding asset. In 2022, the fastest monetary response since the Volcker era pulled real rates back into positive territory, restoring that opportunity cost.
Do inflation-linked bonds fully protect against inflation?
They protect the indexation of the principal on the price index, but not the rate risk. When real rates rise, the market value of a long inflation-linked bond falls, even if its principal keeps tracking inflation faithfully. The protection covers one axis and leaves the other exposed.
Is cash always a poor protection against inflation?
No: its real return depends on the regime. When short rates exceed inflation, as happened after the 2022 to 2023 tightening, interest-bearing cash posted a positive real return. When inflation exceeds short rates, as in 2021 and 2022, it erodes.
Does a capital guarantee protect against inflation?
It protects nominal capital, not purchasing power. A capital guaranteed in nominal terms keeps its face value but loses real value whenever inflation exceeds the credited rate. Nominal guarantee and real protection coincide only in the regime where the return covers inflation.
- No asset has protected savings across every inflationary episode since 1971: each reputed protection went through at least one decade of real decline.
- What separates the protections is the path of real rates accompanying inflation, not the nominal level of the rise in prices.
- “Protecting savings” covers three distinct objectives, preserving nominal capital, preserving purchasing power, and beating inflation, which call for different answers.
- A protection set for the past regime becomes a risk at the shift: the cost of mistiming the regime often exceeds that of picking the wrong asset.
Last updated — 23 September 2026
Disclaimer – Financial and Legal Information: The analyses, commentary, and content published on eco3min.fr are provided for informational and educational purposes only. They do not constitute investment advice or a solicitation to buy or sell financial instruments. Past performance is not indicative of future results. All investment decisions involve risk and are the sole responsibility of the reader. Data, charts and calculated series are provided as is and may contain errors or lag behind their source: check any figure against the primary source cited before relying on it. Content describing laws, regulations or contracts reflects the law as of its publication date and does not constitute legal or tax advice; applying it to a specific situation requires a qualified legal or tax professional.
Read next
Full pillar →Target-Date Funds vs Self-Directed Portfolios: The Mechanics of a Delegated Glide Path
A target-date fund is sold as a simple, set-and-forget win. It is first something narrower: a delegated glide…
What Guaranteed Savings Products Have Paid: Fixed Annuity and Stable Value Yields Through the Rate Cycle
US guaranteed savings products credit a rate that trails the bond market rather than tracking it. Through the…
Beneficiary Designations, the Step-Up in Basis, and the 10-Year Rule: How US Accounts Transfer at Death
At death, most US financial accounts pass outside the will, straight to a named beneficiary, under tax rules…